
Current Market Data
Active buyers are looking for more expensive homes, while price-constrained buyers are looking at fewer homes altogether.
Of the 50 metro areas surveyed by NAR, several stood out for year-over-year gains in contract signings.

The move was an improvement over July, but sentiment still remained in negative territory.
Looking ahead, Cotality expects the median price of a home to increase 1.5% through June 2027.
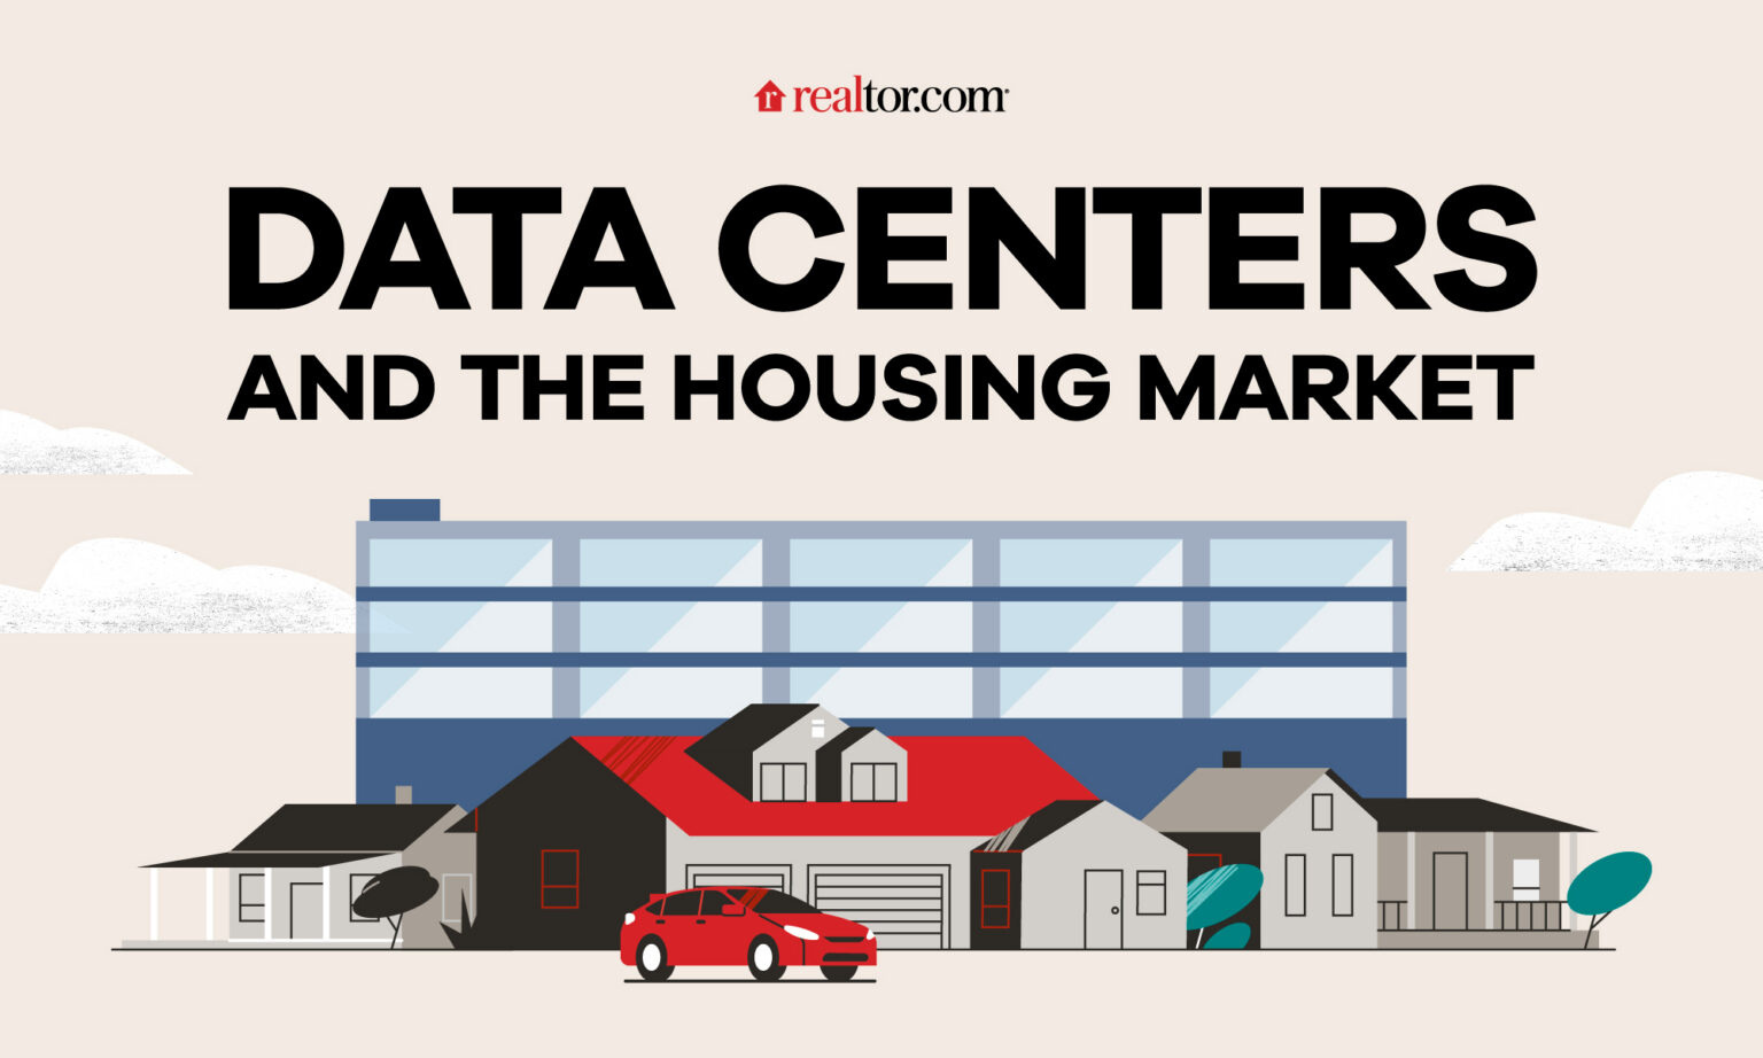
Three years after the opening of a large center, ZIP codes retained 66% of their pre-opening active listings, compared to 43% in similar areas without a data center.
Nationally, home-price growth topped 1% for the first time in 2026.
The seasonally adjusted annual rate of 628,000 homes topped Wall Street’s estimates.

Curb appeal is important to today’s homeowners — that is, they want the exteriors of their homes to appeal to their own preferences and sensibilities rather than those of potential buyers.
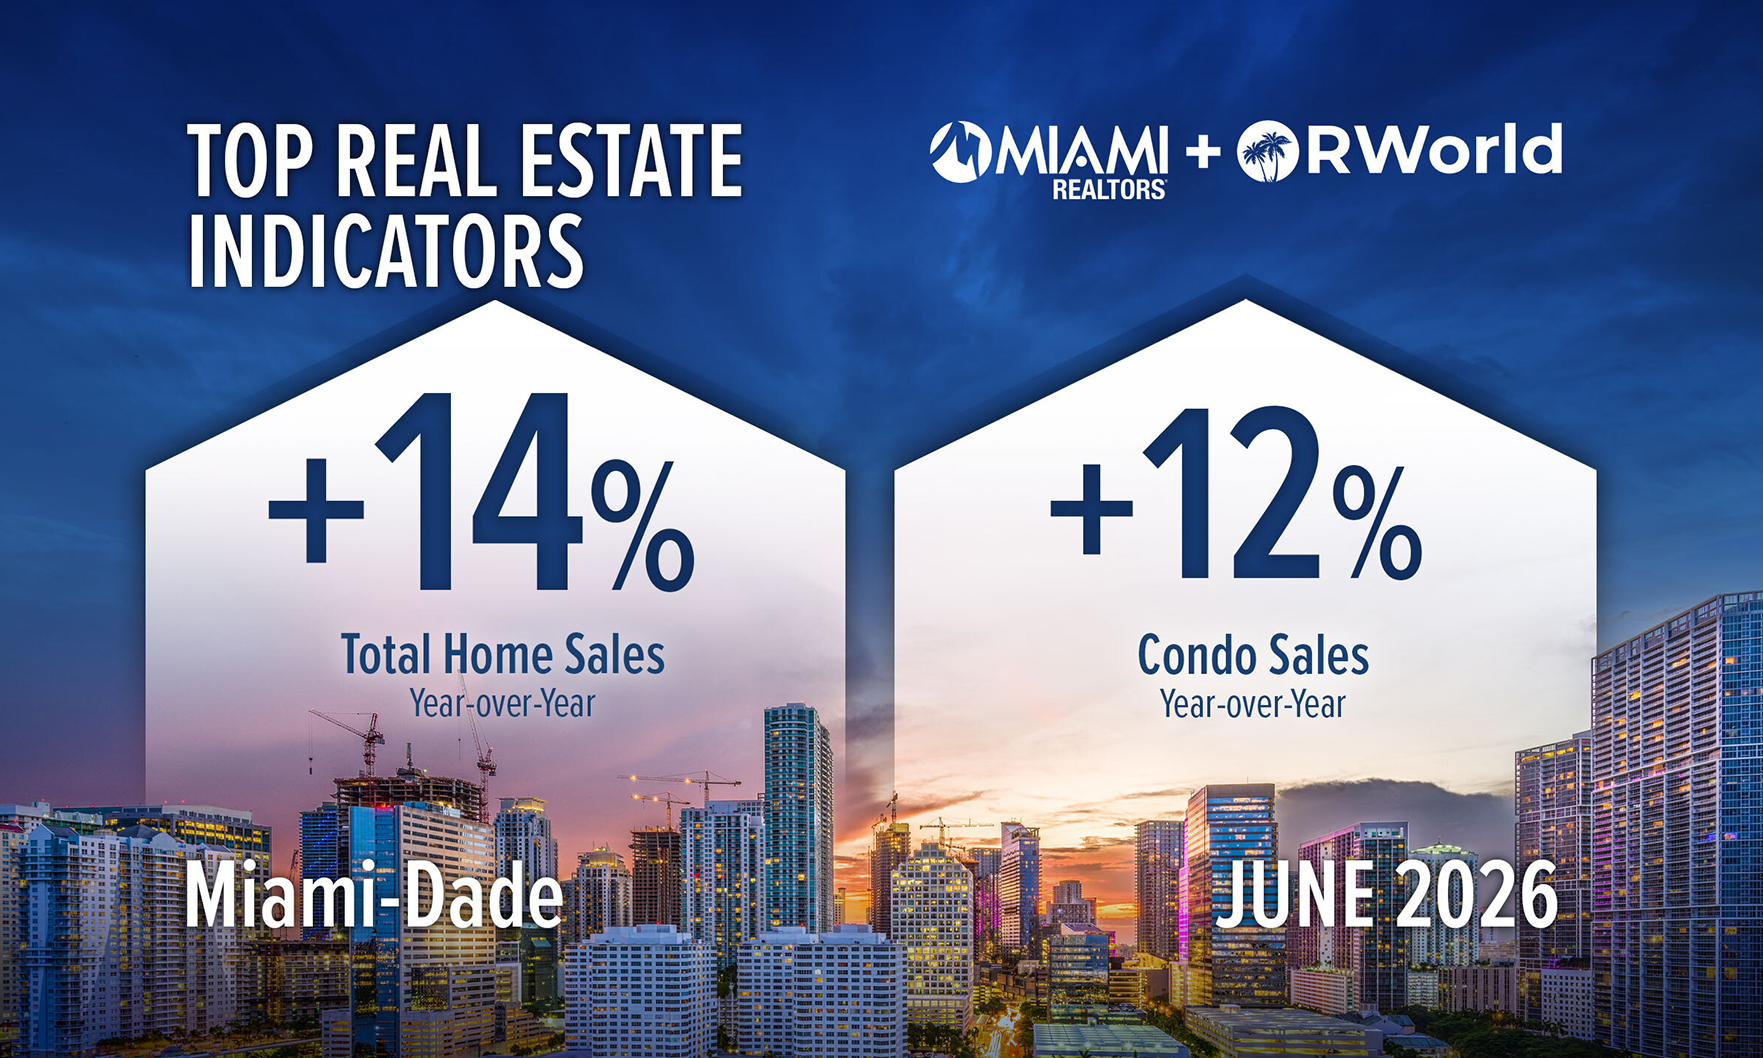
June also represented the 10th month in a row of gains.

The triennial survey of 2,000 American residents from the 50 largest metropolitan areas, the National Association of REALTORS® Community and Transportation Preference Survey, found buyers and residents prefer more housing options and communities designed for easy access.
Nationally, home sales in the 51 metro areas surveyed by REMAX showed measured growth of 8.9% month over month and 7.8% year over year, REMAX said.
The annual and monthly declines of 0.3% and 5.4%, respectively, do not fully capture the geographic variability of market performance.
The median sales price of a home hit an all-time high of $440,600.
Looking ahead, Cotality expects home prices to rise 4.8% between May 2026 and May 2027.
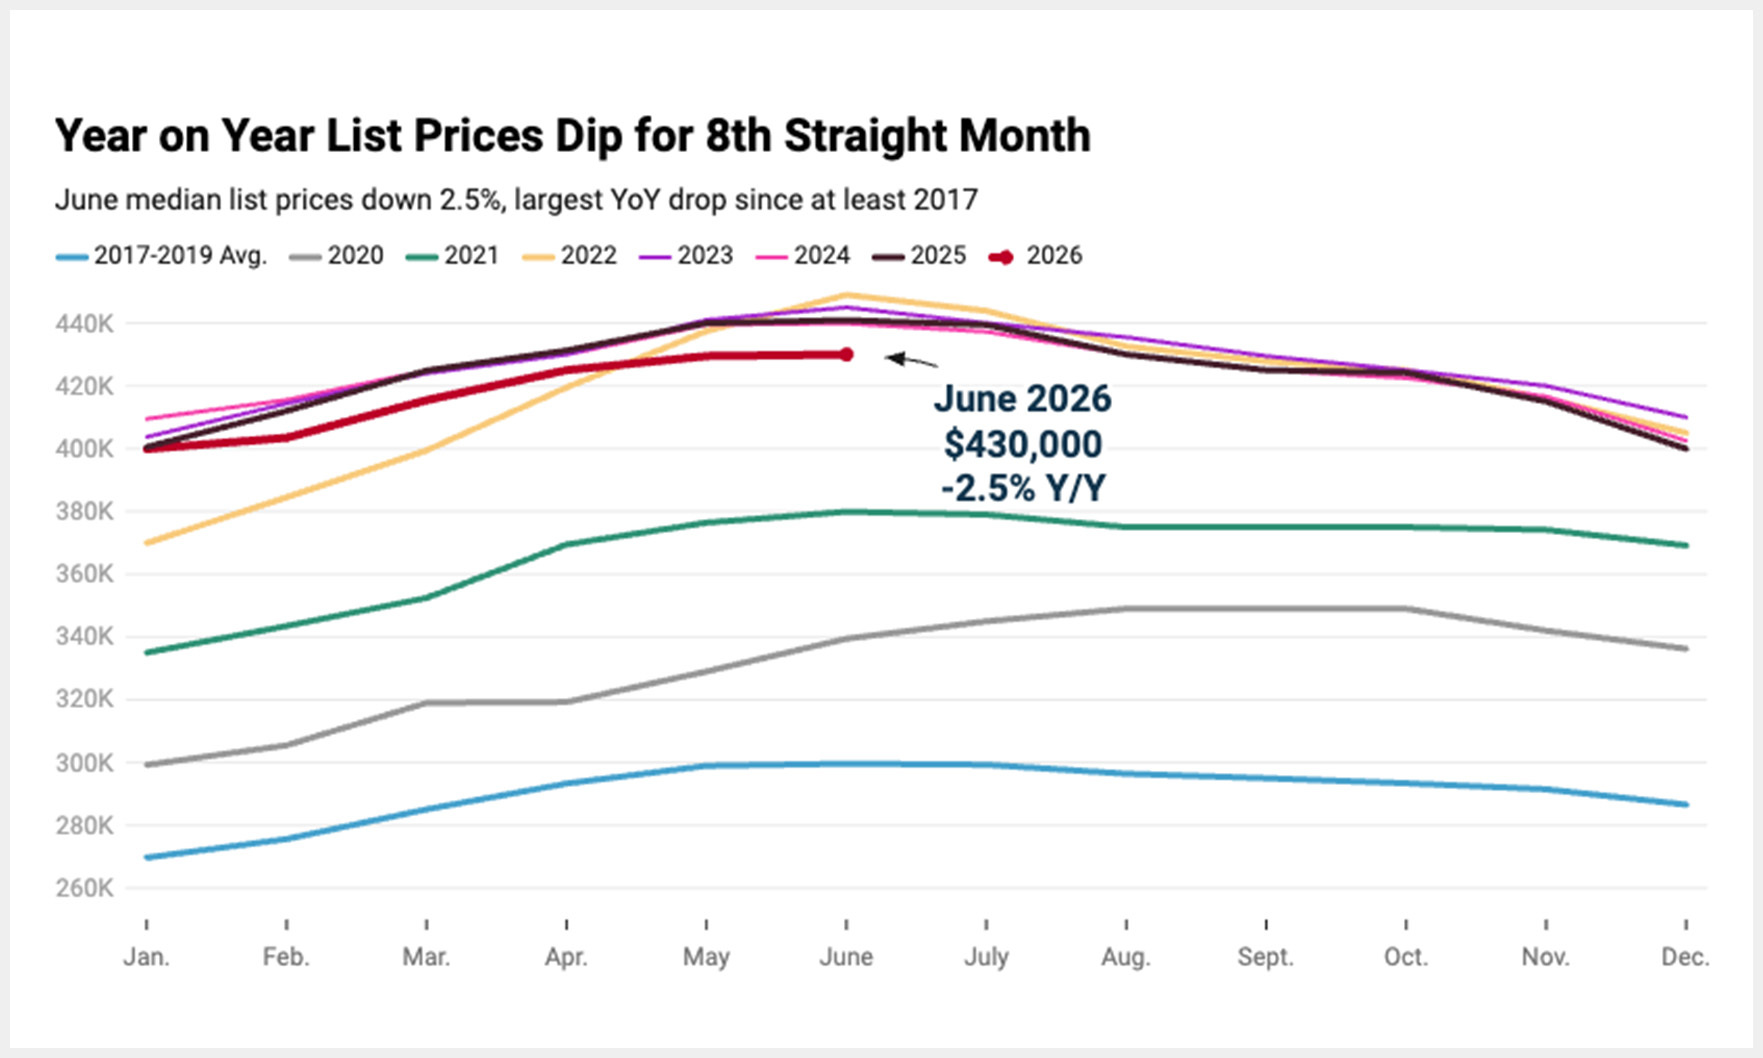
Nationally, the median list price slipped 2.4%, marking the eighth month in a row of declines.
The uptick was driven by a slight dip in mortgage rates.