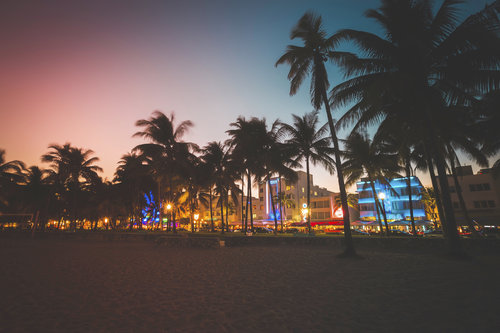
Luxury housing markets across the U.S. have seen declines in 2016, but according to a new analysis from Redfin, only one market has slowed more than Miami Beach.
Through Q1 2016, the average sale price for luxury homes in Miami Beach was $5.738 million, a 13.7 percent decline from Q1 2015. That was the second-largest such decline in the country, and meanwhile, the average sales price for the rest of the Miami Beach market fell 1.6 percent to $599,000.
What Ails Luxury Housing
What could be behind the declines in luxury housing? According to Redfin’s report, there are two major causes – the fluctuations in the stock market and the strong U.S. dollar.
On the stock market side, falling shares negatively impact high-net-worth consumers’ portfolios, making them less likely to purchase pricey real estate. And though a strong U.S. dollar has some benefits – for instance, goods from other countries are cheaper – it also makes American real estate more expensive to foreign consumers, who have a large presence in luxury markets across the country.
Redfin Chief Economist Nela Richardson explained: “Luxury buyers are out of step with the rest of the market because their wealth is at stake. Instead of cheering rock-bottom mortgage rates, luxury buyers recoiled from high-end spending in the face of volatile asset prices.”
Here is a chart showing how luxury markets have stalled across the country:
| City | Avg Sale Price –Luxury | YOY Change | Avg Sale Price – Rest of Market | YOY Change |
|---|---|---|---|---|
| Sandy Springs | $1,546,000 | -14.9% | $361,000 | 3.1% |
| Miami Beach | $5,738,000 | -13.7% | $599,000 | -1.6% |
| Austin | $1,504,000 | -11.8% | $352,000 | 5.1% |
| Boston | $3,190,000 | -11.8% | $608,000 | 6.3% |
| Alexandria | $1,408,000 | -6.9% | $440,000 | -0.2% |
| San Diego | $2,477,000 | -5.9% | $529,000 | 0.8% |
| Houston | $1,377,000 | -5.1% | $232,000 | 0.9% |
| San Francisco | $4,407,000 | -4.7% | $1,217,000 | 4.5% |
| Pompano Beach, FL | $1,123,000 | -4.2% | $197,000 | 4.2% |
| Washington, D.C. | $2,042,000 | -4.2% | $537,000 | 1.1% |
| Spring, TX | $1,077,000 | -4.1% | $226,000 | -7.8% |
| Los Angeles | $4,186,000 | -1.3% | $690,000 | 10.4% |
| Bend, OR | $1,067,000 | -0.7% | $379,000 | 6.5% |
| San Jose | $1,960,000 | -0.6% | $788,000 | 5.3% |


Did this study also break down the sales by sold $/square foot and compare that YoY? Miami Beach in particular has a broad range of property types and although they get the data from $1M+ properties sold, overall sale price may not precisely capture the full view given that properties vary in square footage, lot size, location in proximity to the beach, etc.
As an example, if Q1 2015 there were 150 sales of which 25 properties that sold for over $5M as compared to Q1 2016 there were 200 sales, of which only 3 were above $5M, then Q1 2015 would have a higher average, thus pretending to trend negatively. The reality would be that there were just less ultra luxury properties available to purchase, not that the market was slumping. The media should be more careful when discussing data trends with the housing market as we are still in the process of recovering. Although I’m not arguing with the reasons why the MB market may not be over-performing, I’m not sure it’s fair to paint it with such a broad brush.