
By the Numbers
The median price of a single-family home sold in the county rose for the 150th month in a row, a new record.
The record-breaking sales price comes as the pace of transactions slid from April, the National Association of REALTORS® said.
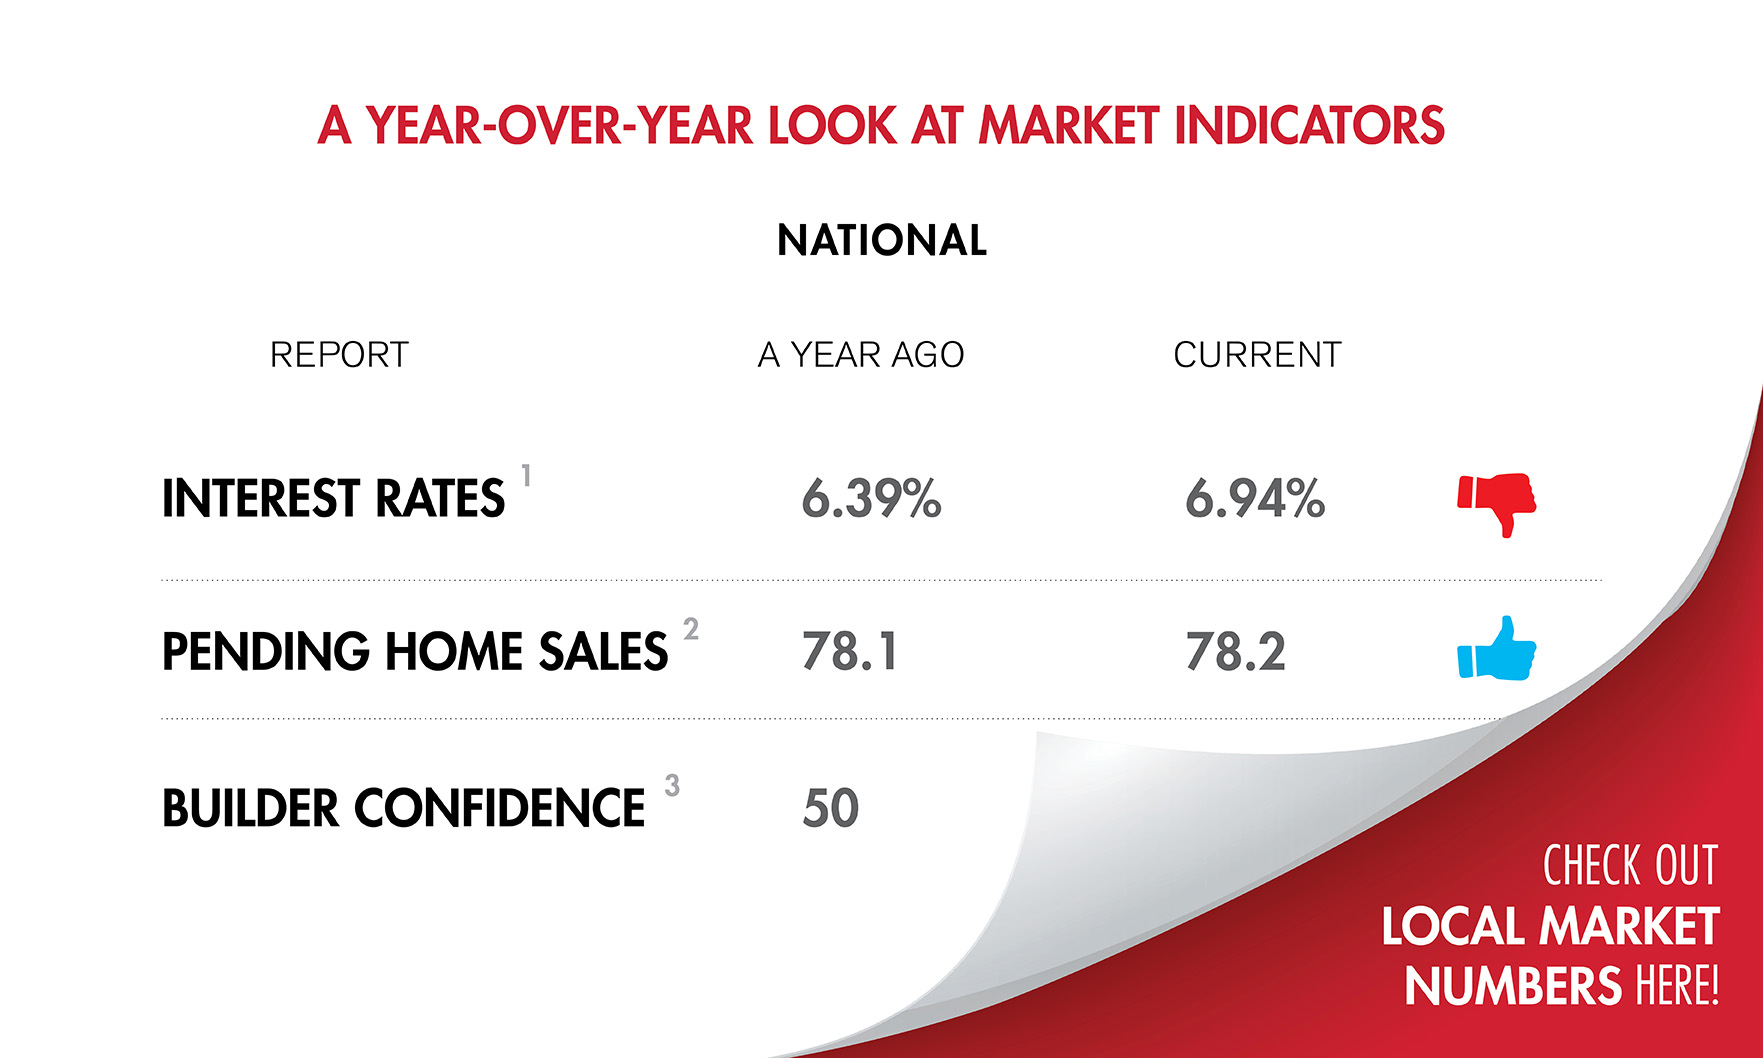
At the same time, inventory also rose in all three South Florida counties.
The S&P CoreLogic Case-Shiller U.S. National Home Price Index has hit a new record for six of the last 12 months, as demand remains strong in the face of tight inventory.
At the same time, the median price of a new home sold in April declined as well.
At the same time, the median prices for single-family homes and condominiums also gained ground.
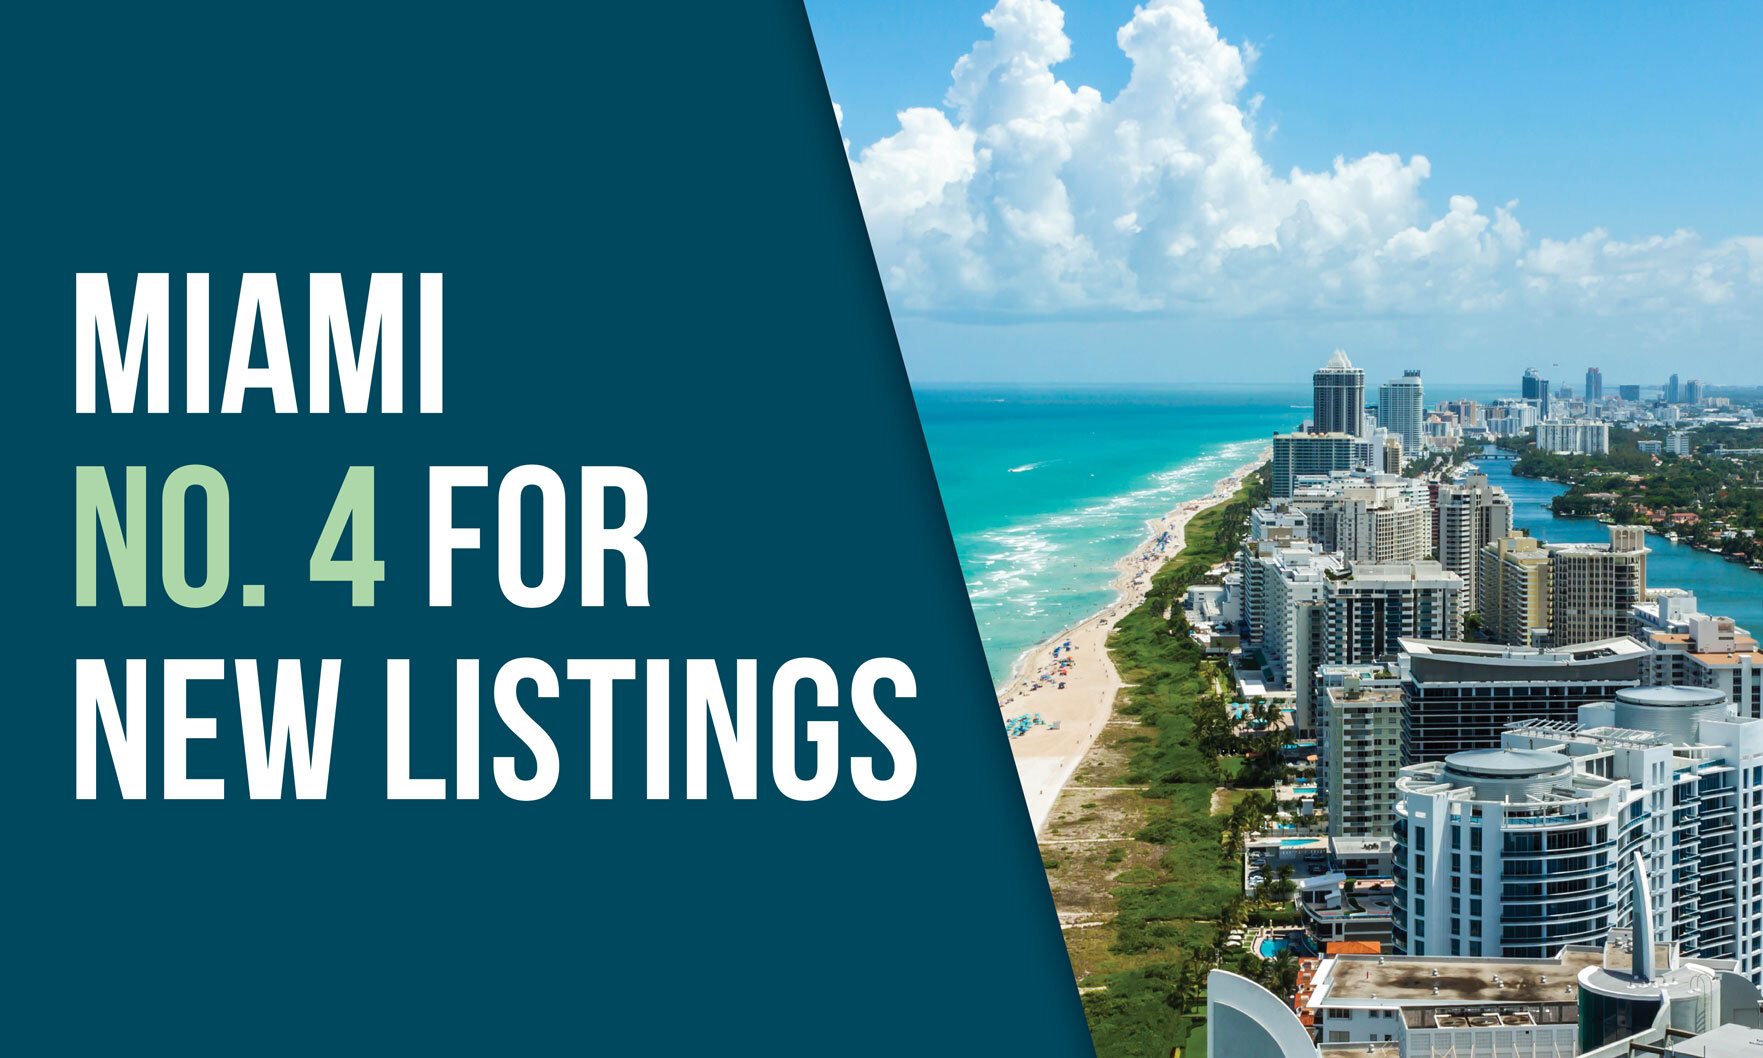
The city saw a 31.2% annual jump in new listings in April and a 54% surge in months’ supply, according to the latest RE/MAX National Housing Report.
New-home construction jumped 5.7% month over month after a soft March, according to the U.S. Census Bureau and the U.S. Department of Housing and Urban Development.
Home sales in Miami-Dade, Broward and Palm Beach counties declined as inventory increased.
Sales rose 9.5% from January to a seasonally adjusted annual rate of 4.38 million.
The median existing-home price for all housing types was $379,100, up 5.1% from $360,800 a year before.
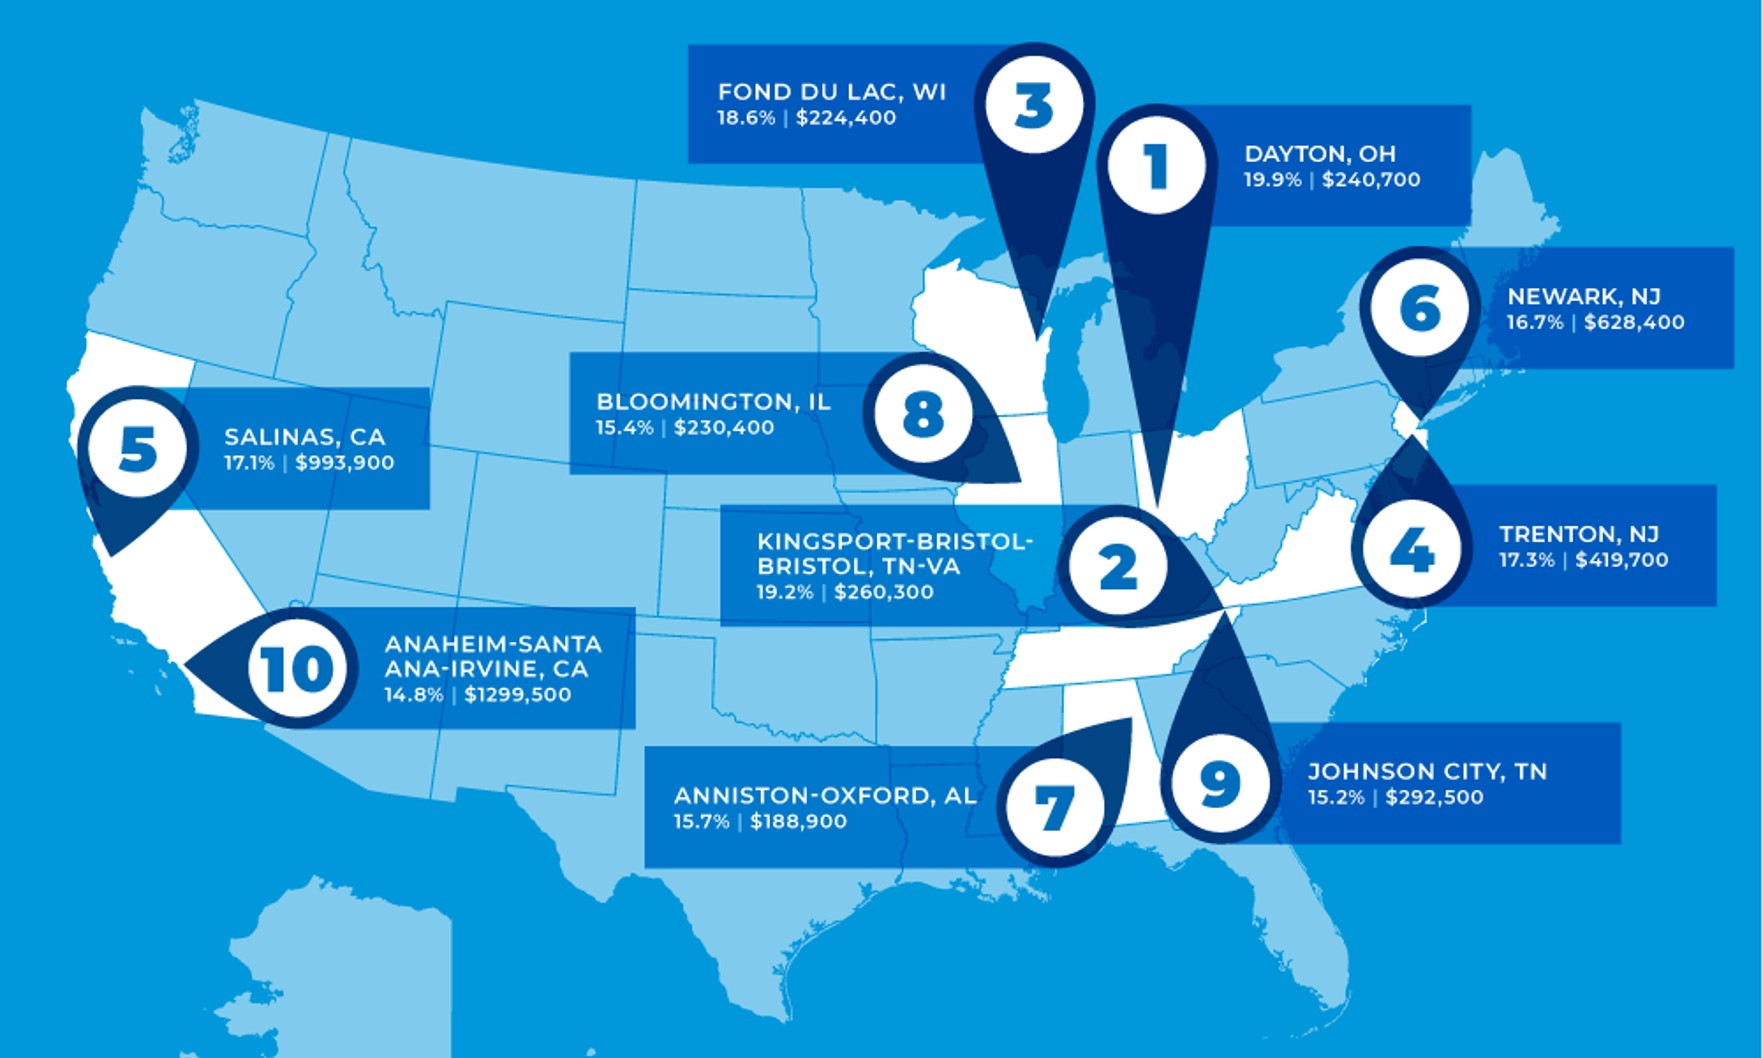
Single-family home sales prices increased in 189 out of 221 metro areas analyzed, with the median single-family price in the country rising 3.5% year over year to $391,700.
Days on market declined in Miami-Dade, Broward and Palm Beach counties.

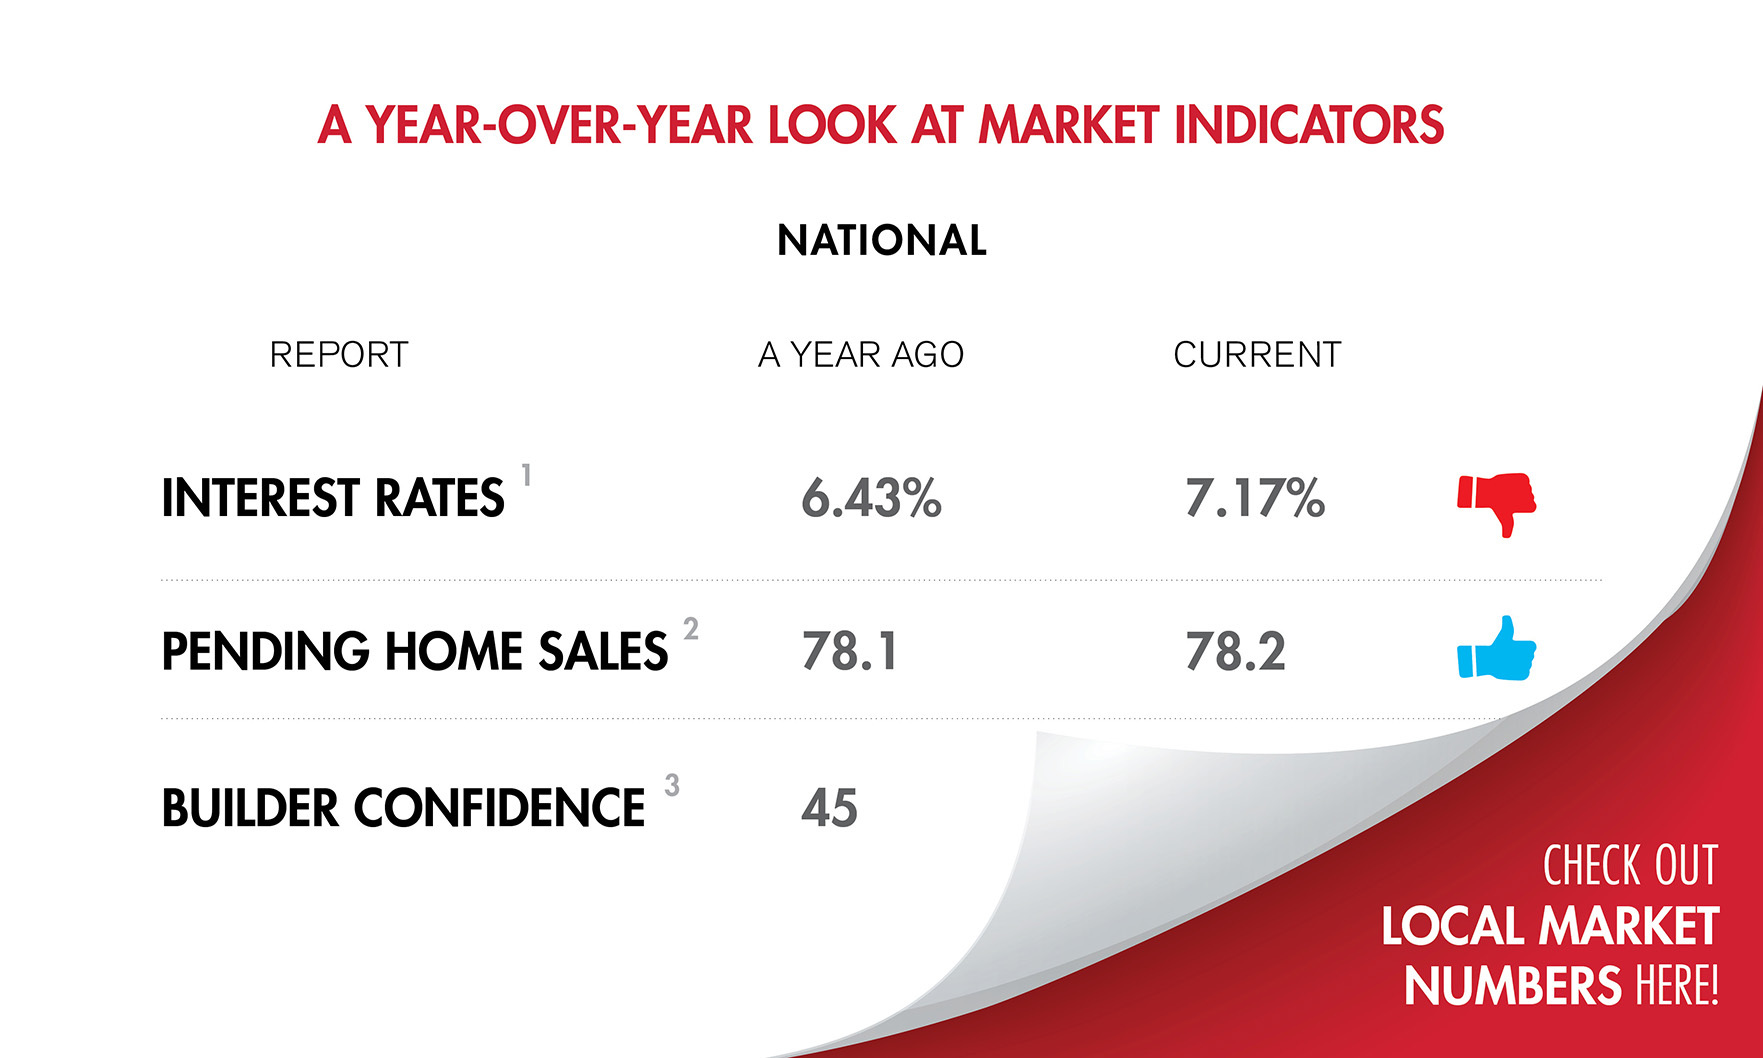
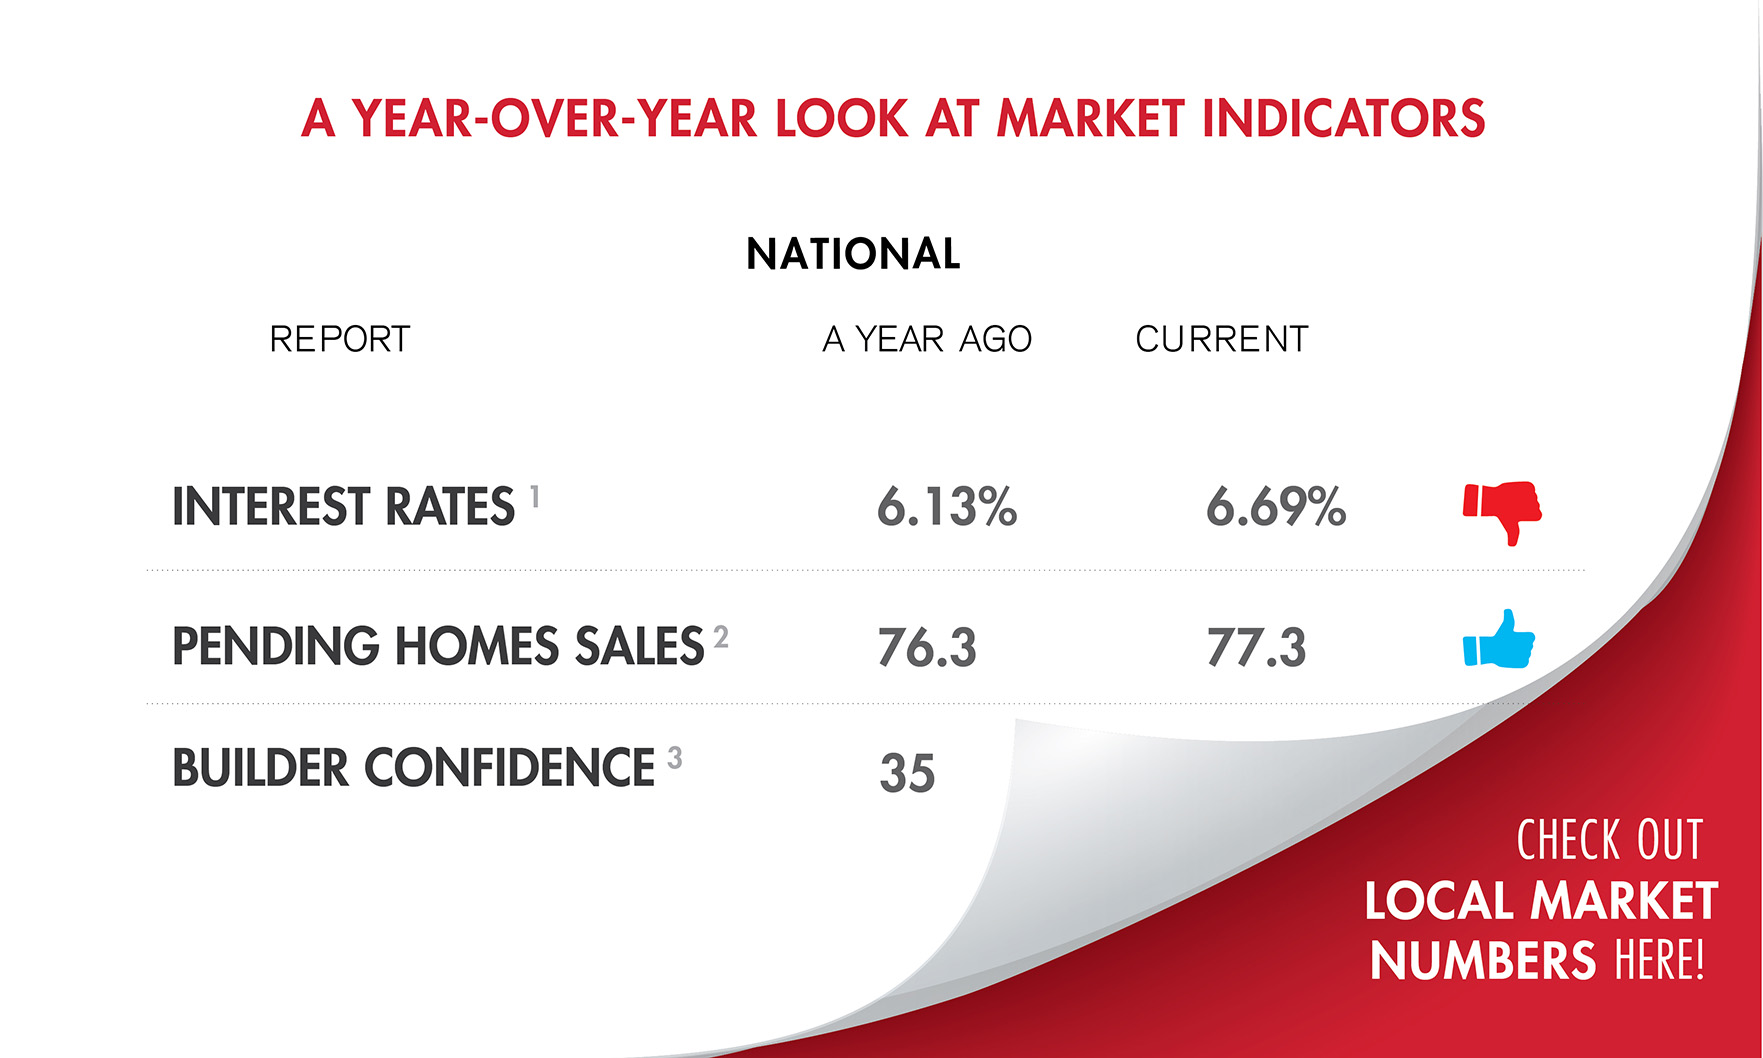
Pending home sales rose 8.3% month over month, the National Association of REALTORS® said, marking the largest monthly jump since 2020.

Declining interest rates spurred the increase.

In Miami, the number of coworking spaces rose quarter over quarter in Q4 2023, while the city’s total square footage of coworking space rose too.