Housing Scorecard
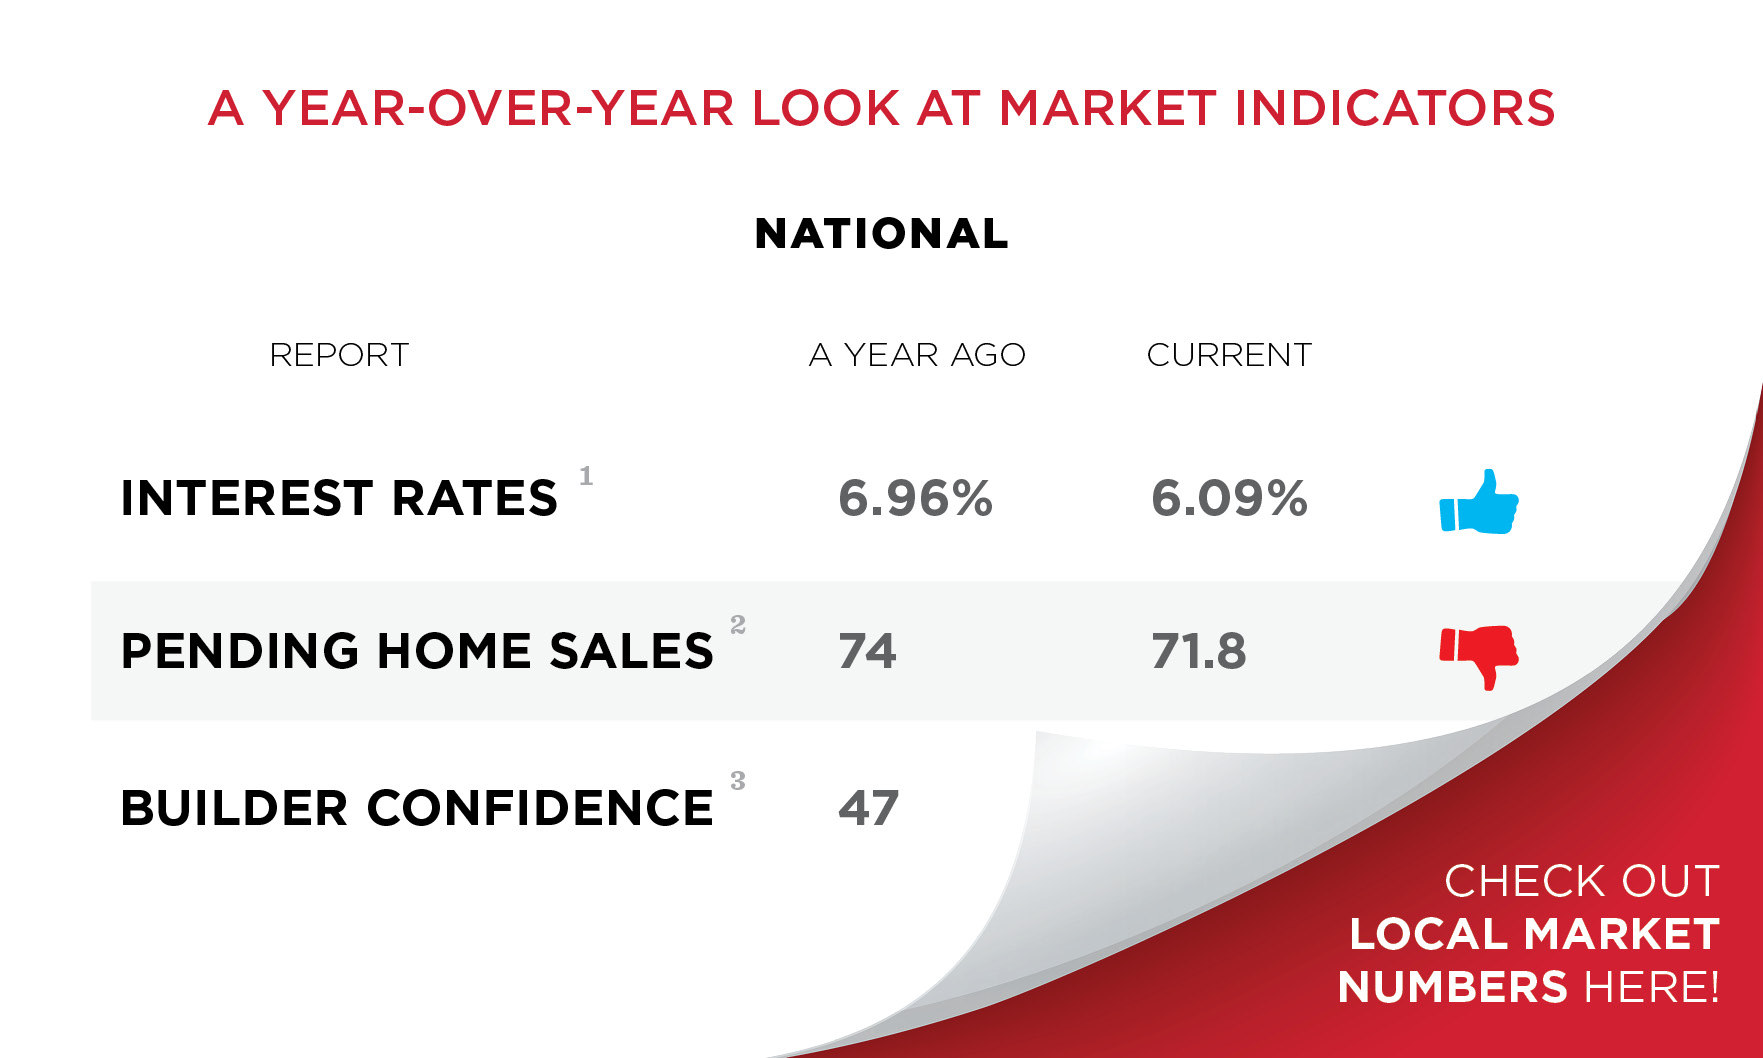
South Florida homes in Miami-Dade, Palm Beach, Broward and Naples lingered on the market. That’s according to the latest Housing Scorecard.
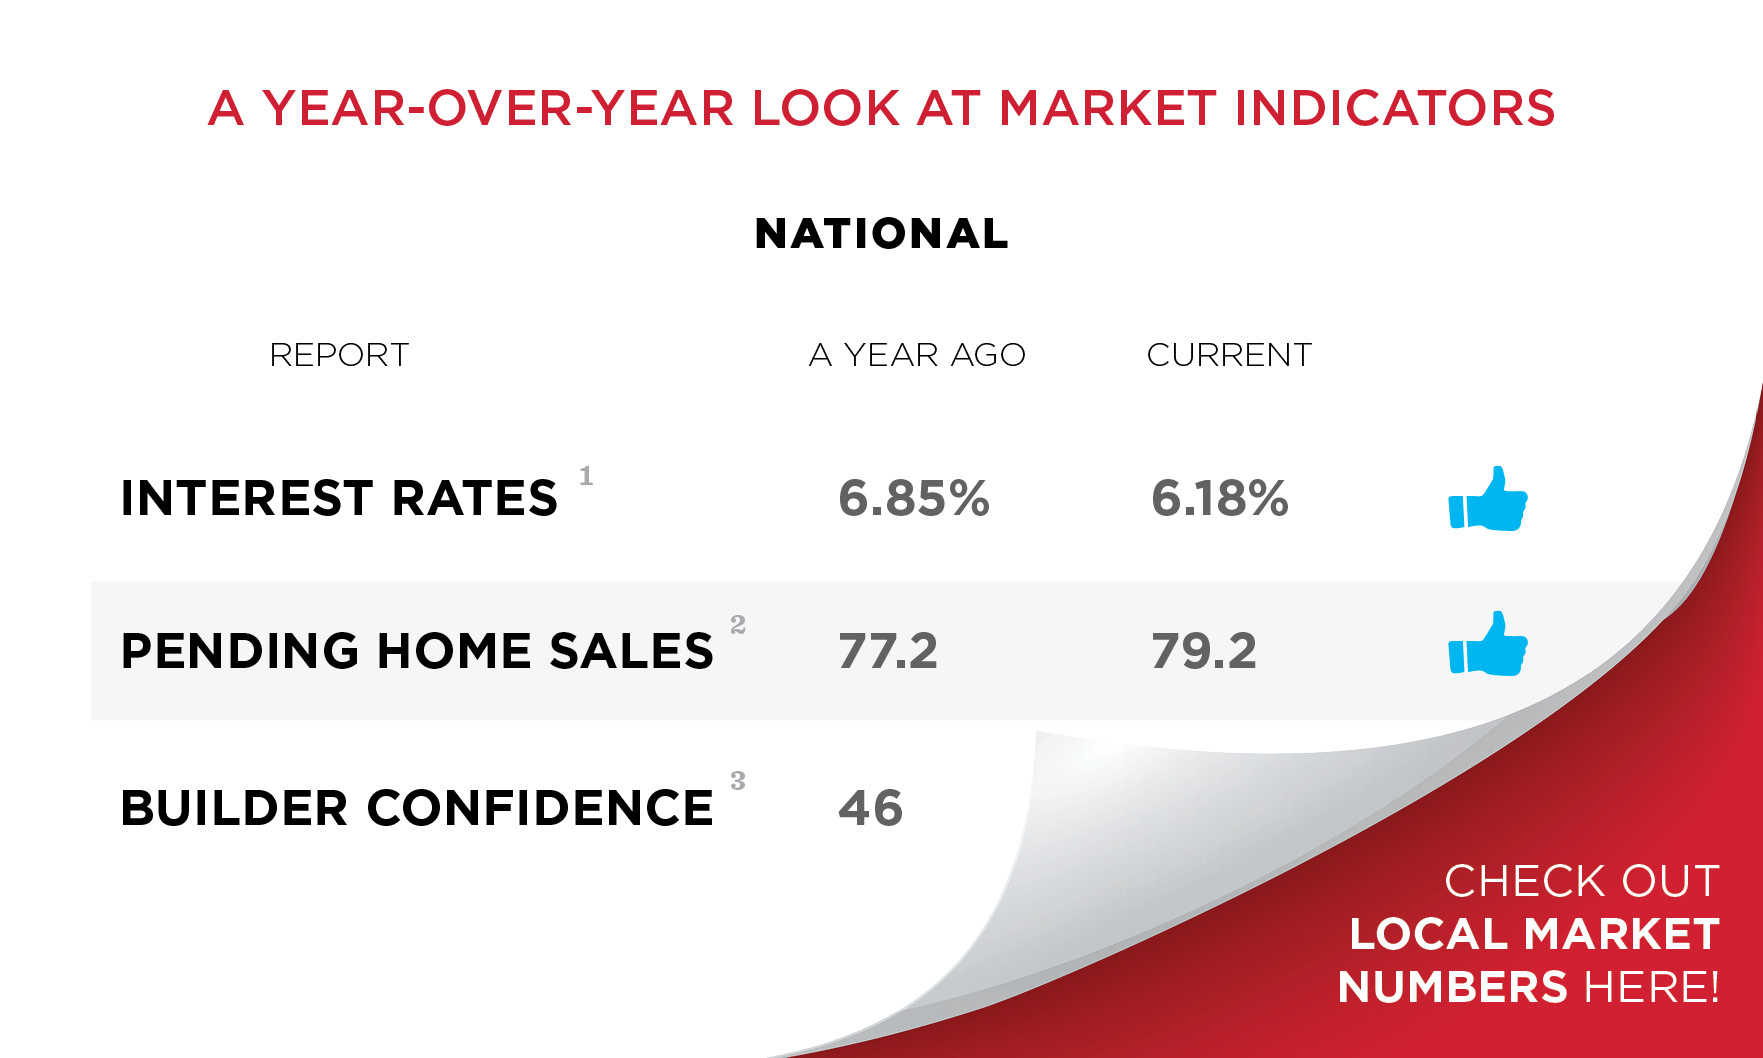
The holiday season brought more than just cheer to South Florida’s housing market. Inventory ticked up and homes sold quickly, according to the latest Housing Scorecard.
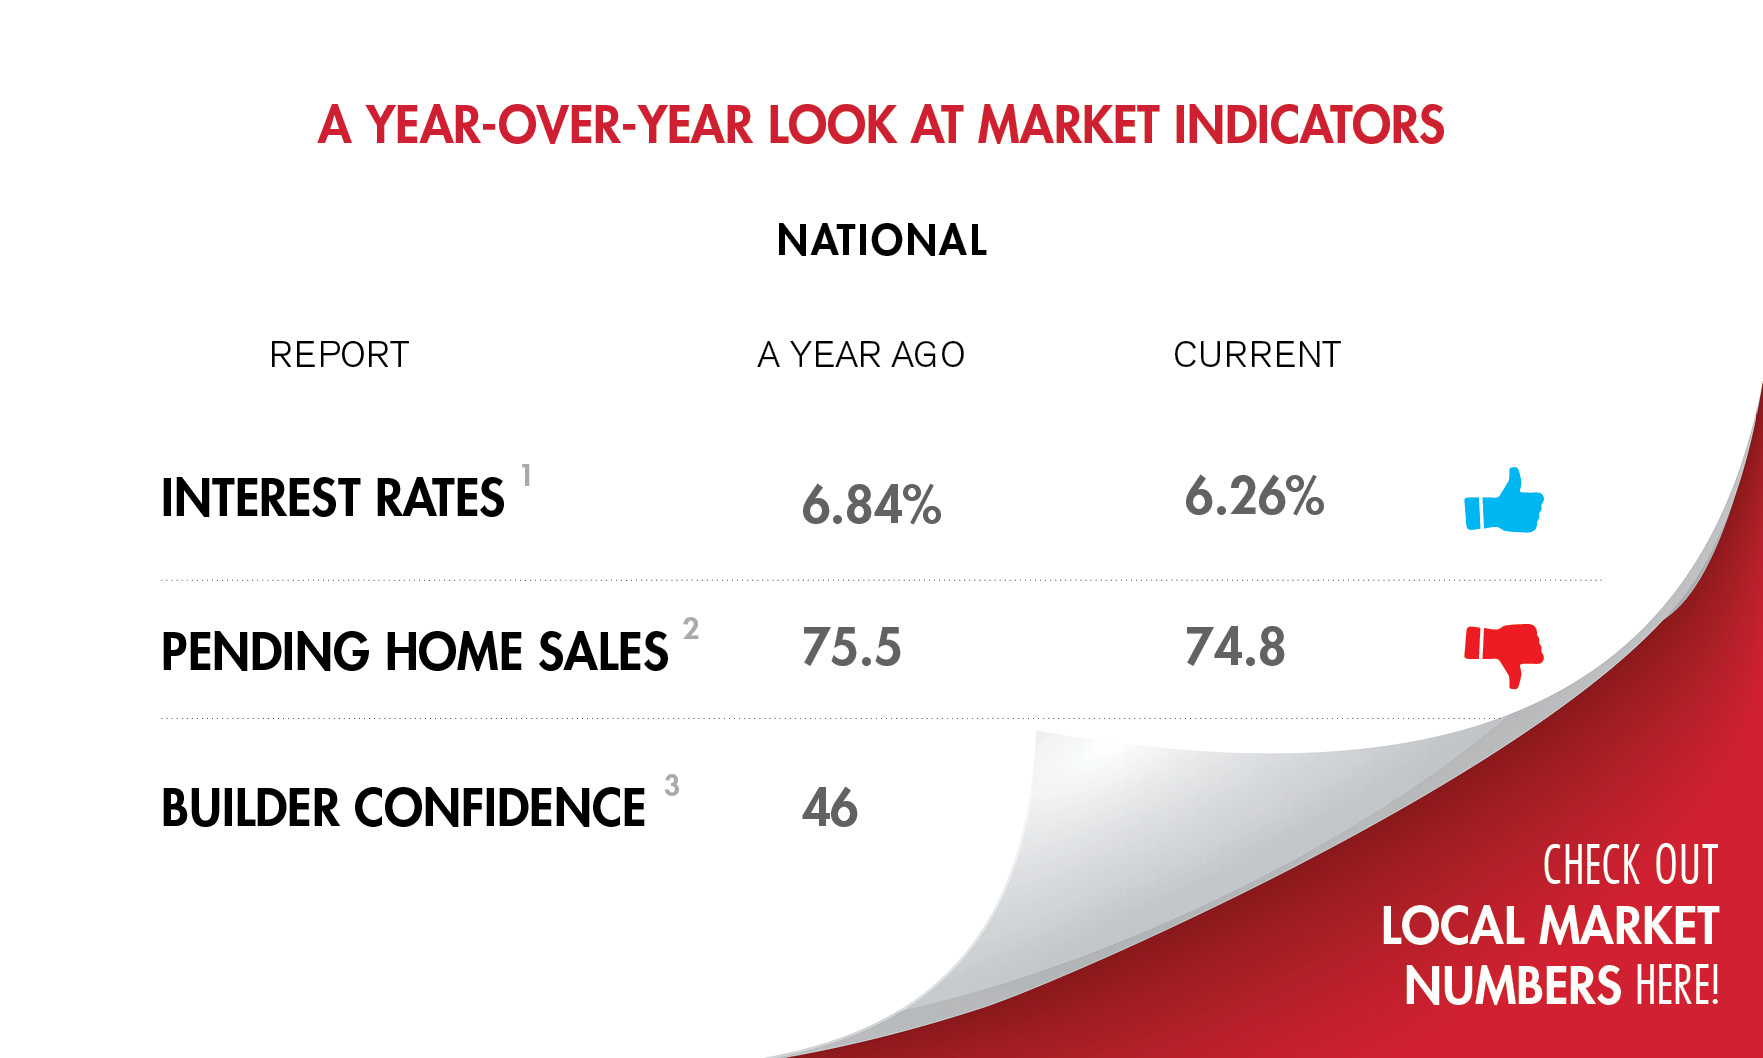
South Florida experienced positive housing inventory growth. Meanwhile, homes stayed on the market slightly longer, according to the latest Housing Scorecard.

Houses lingered on the market last month in South Florida’s market. Meanwhile, inventory boomed and existing-home sales grew, according the latest Housing Scorecard.
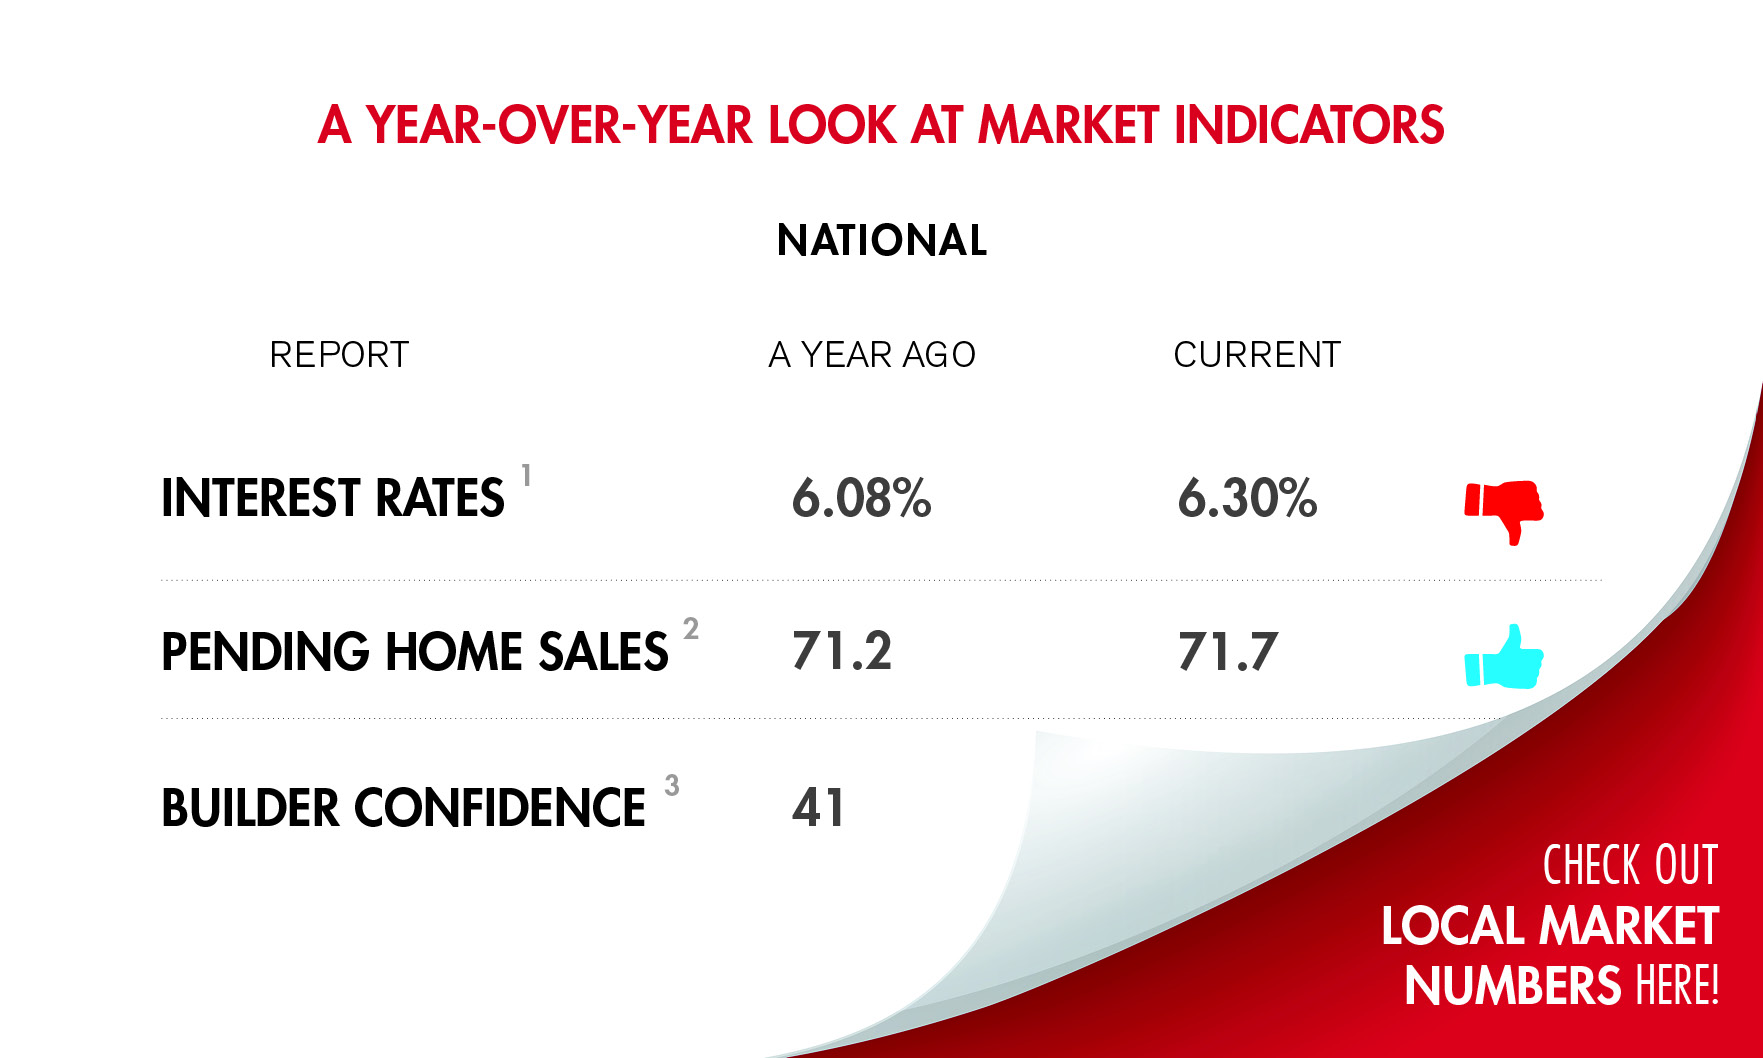
Homes spent longer on the market in South Florida. Meanwhile, inventory continued to increase, according to the latest housing scorecard.
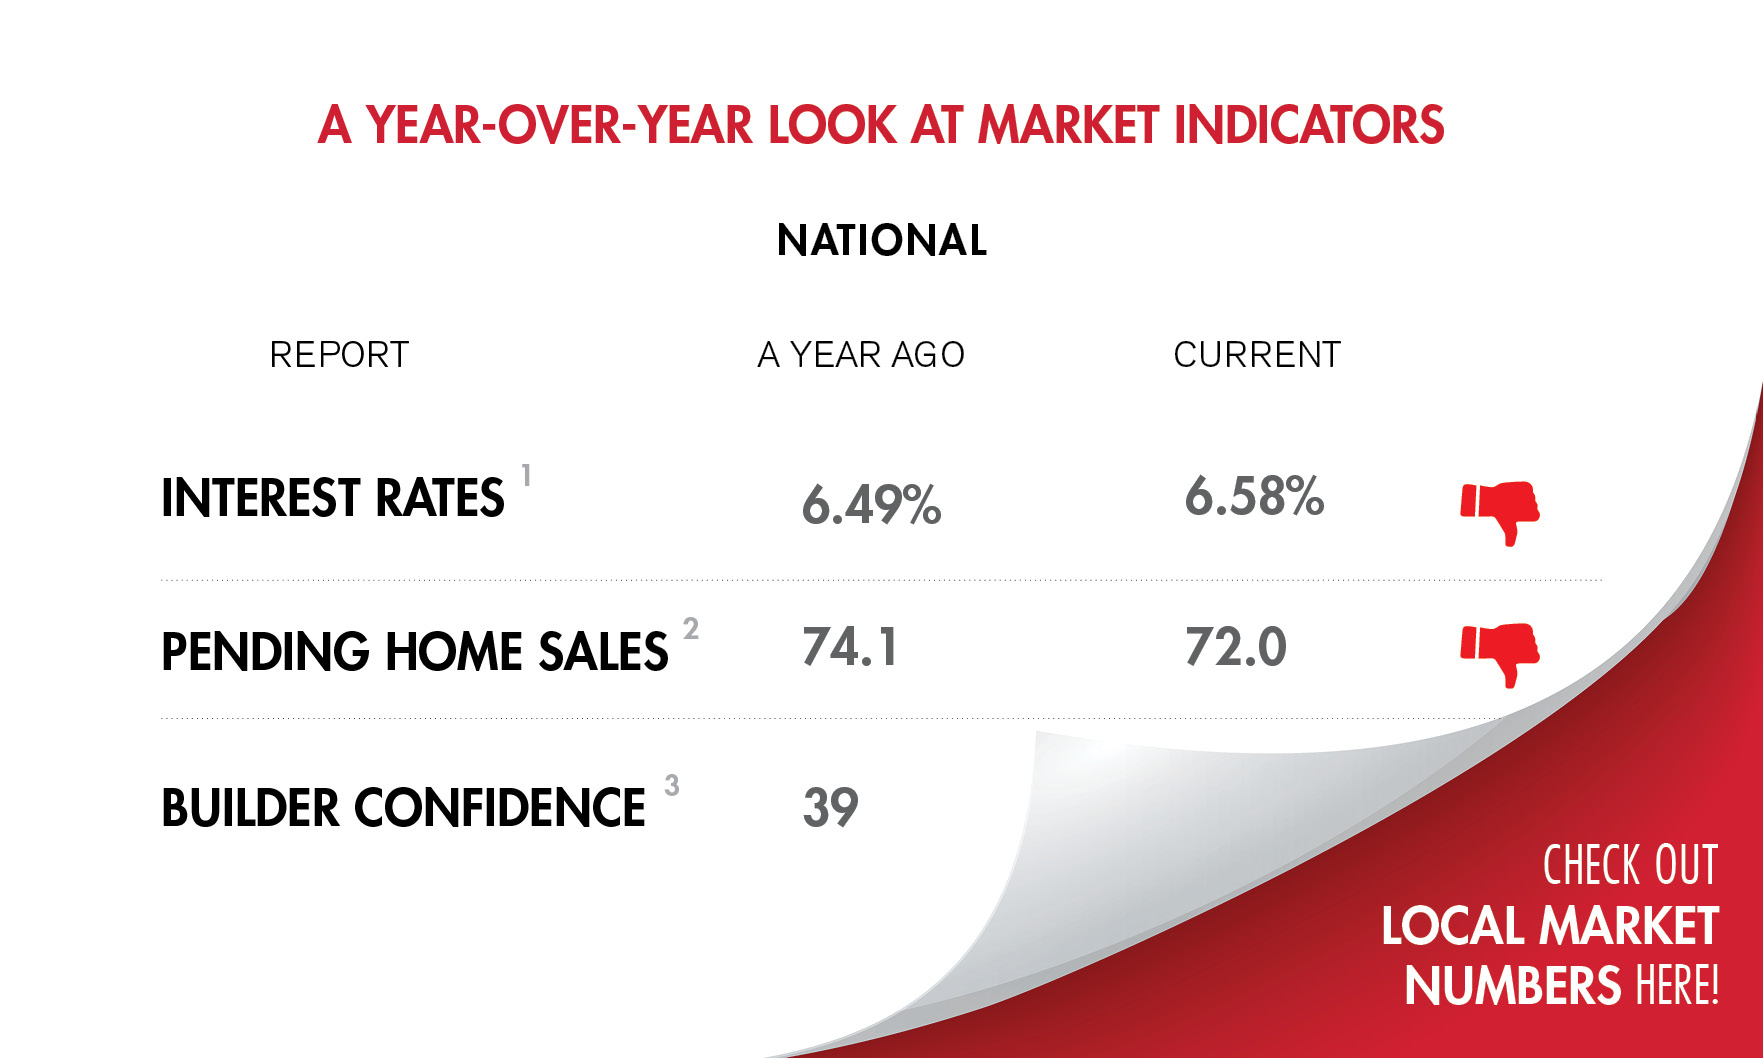
At the same time, existing-home sales fell, housing starts were mixed, and days on market jumped.
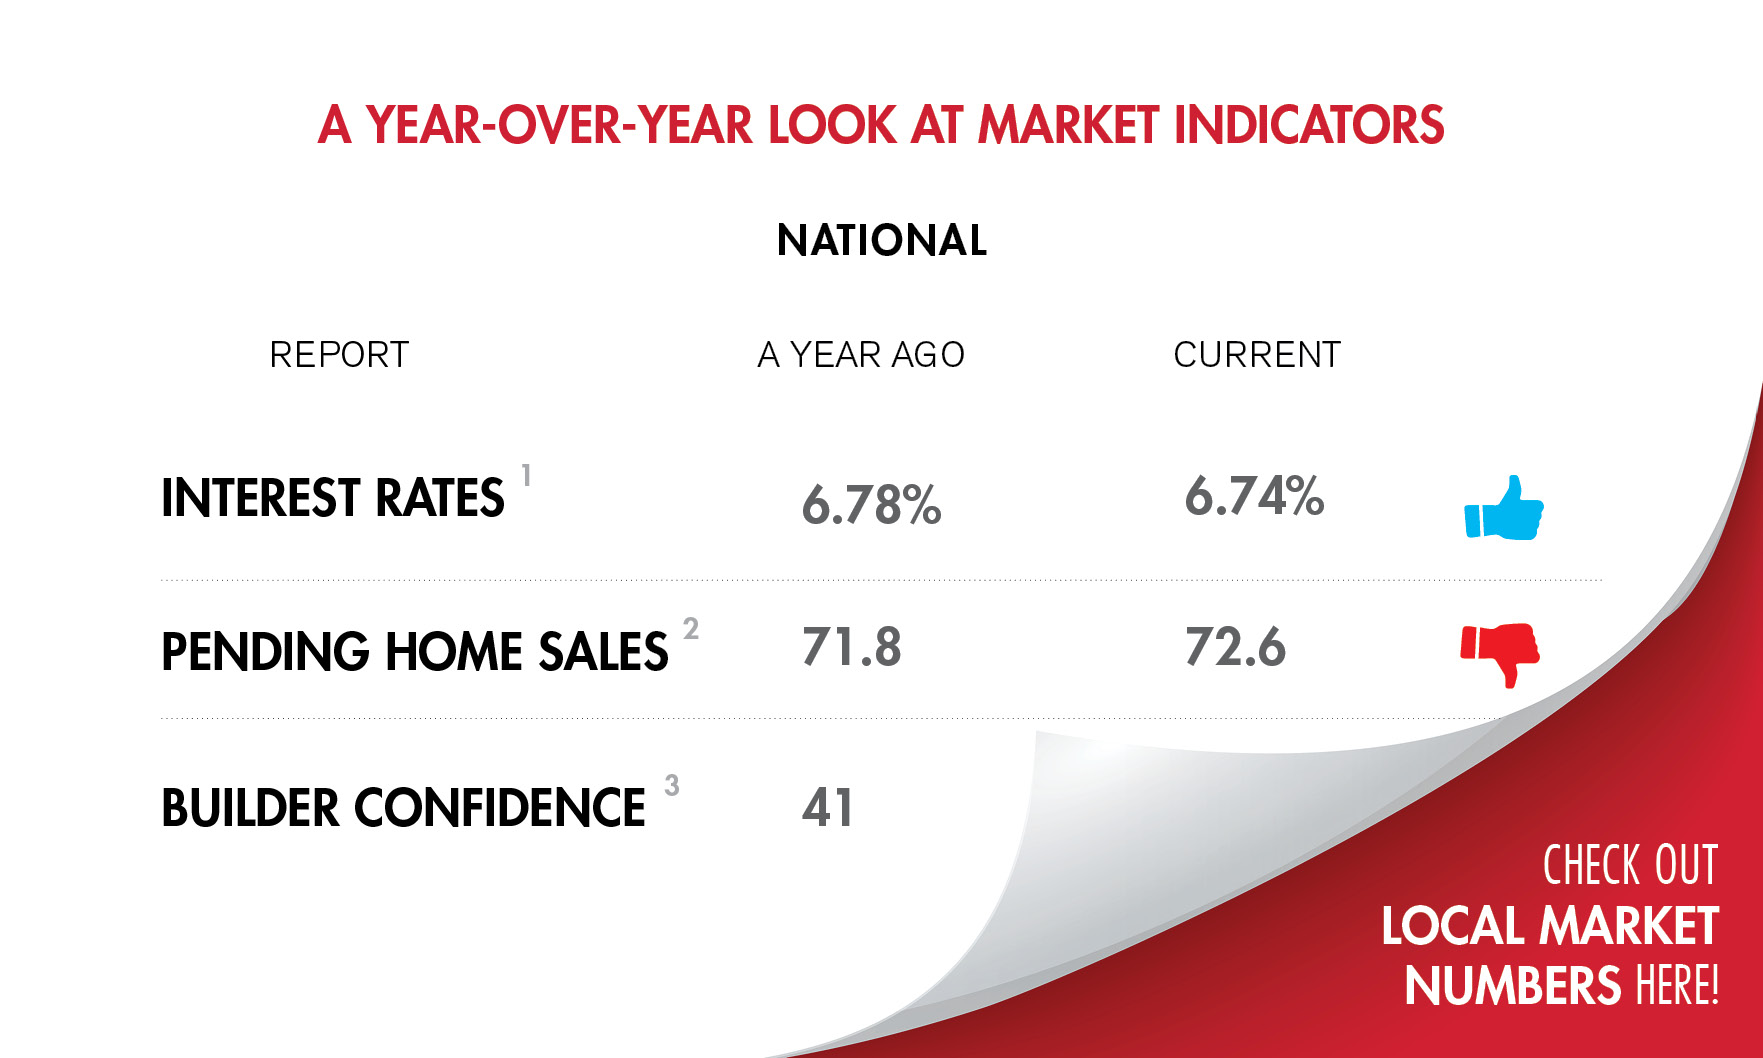
Across South Florida, days on market and housing inventory rose as existing-home sales declined, according to this month’s Housing Scorecard.
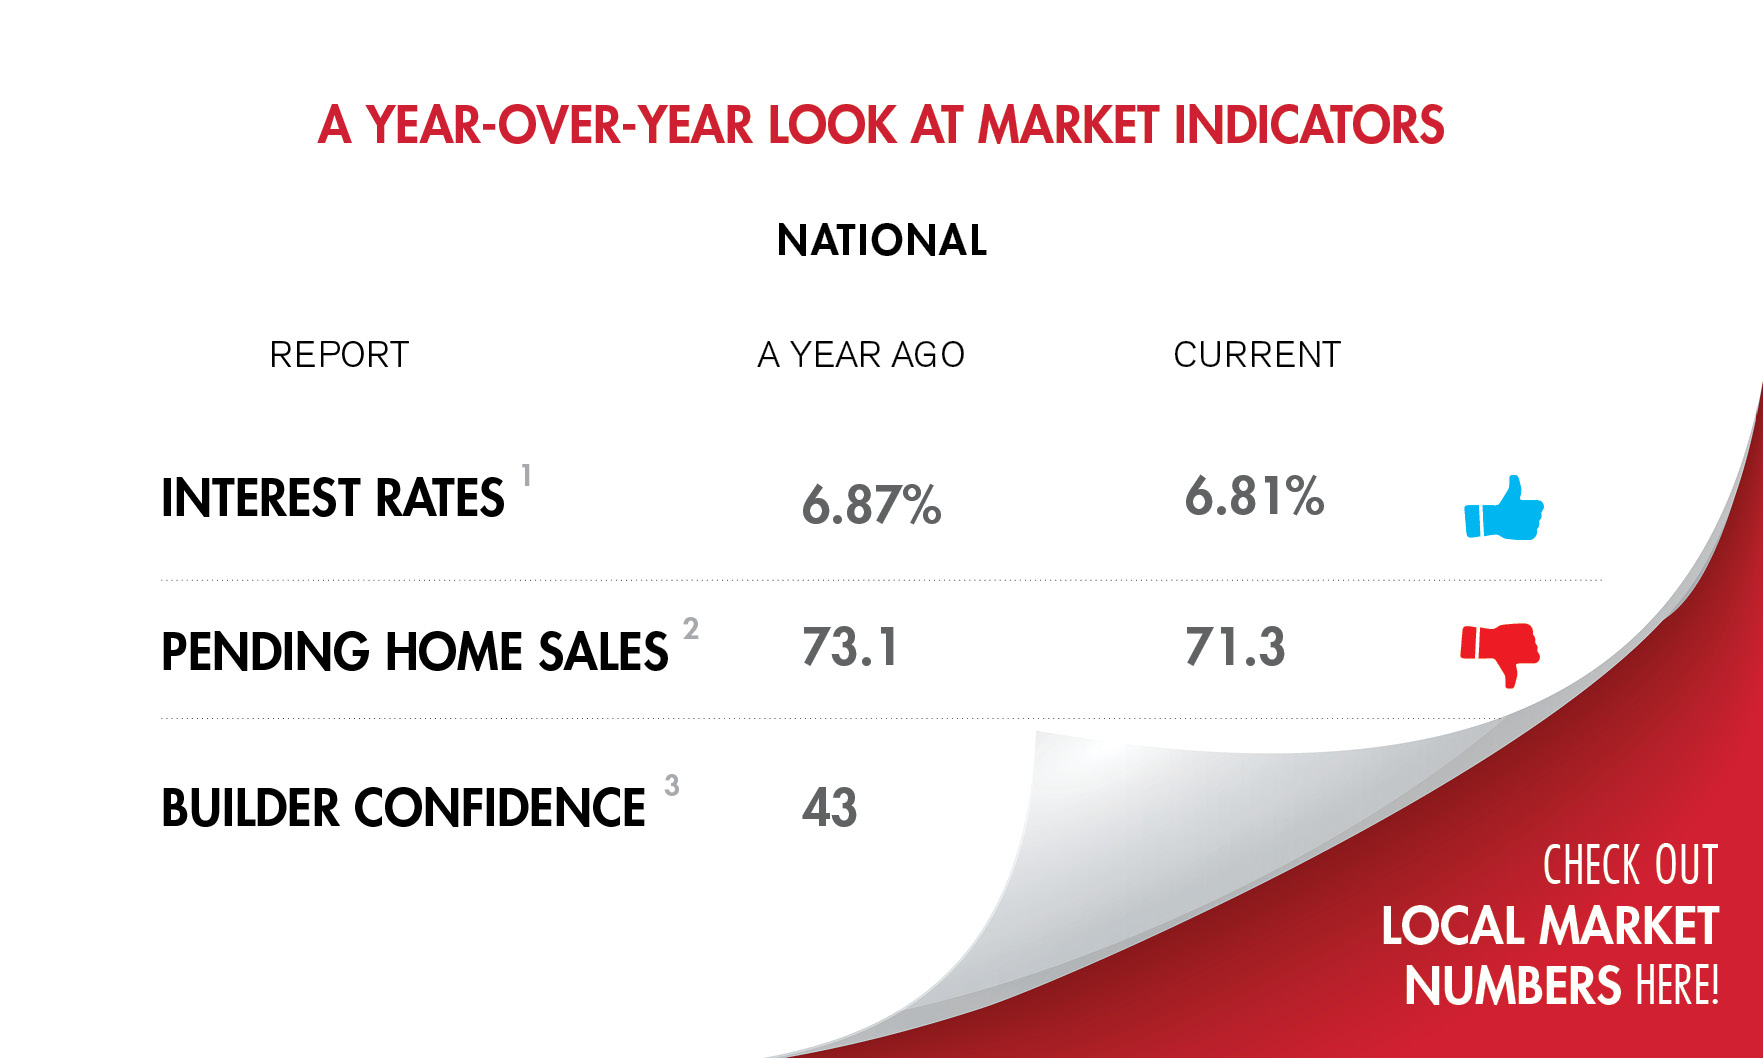
Existing-home sales rose in Broward County but fell elsewhere in the region.
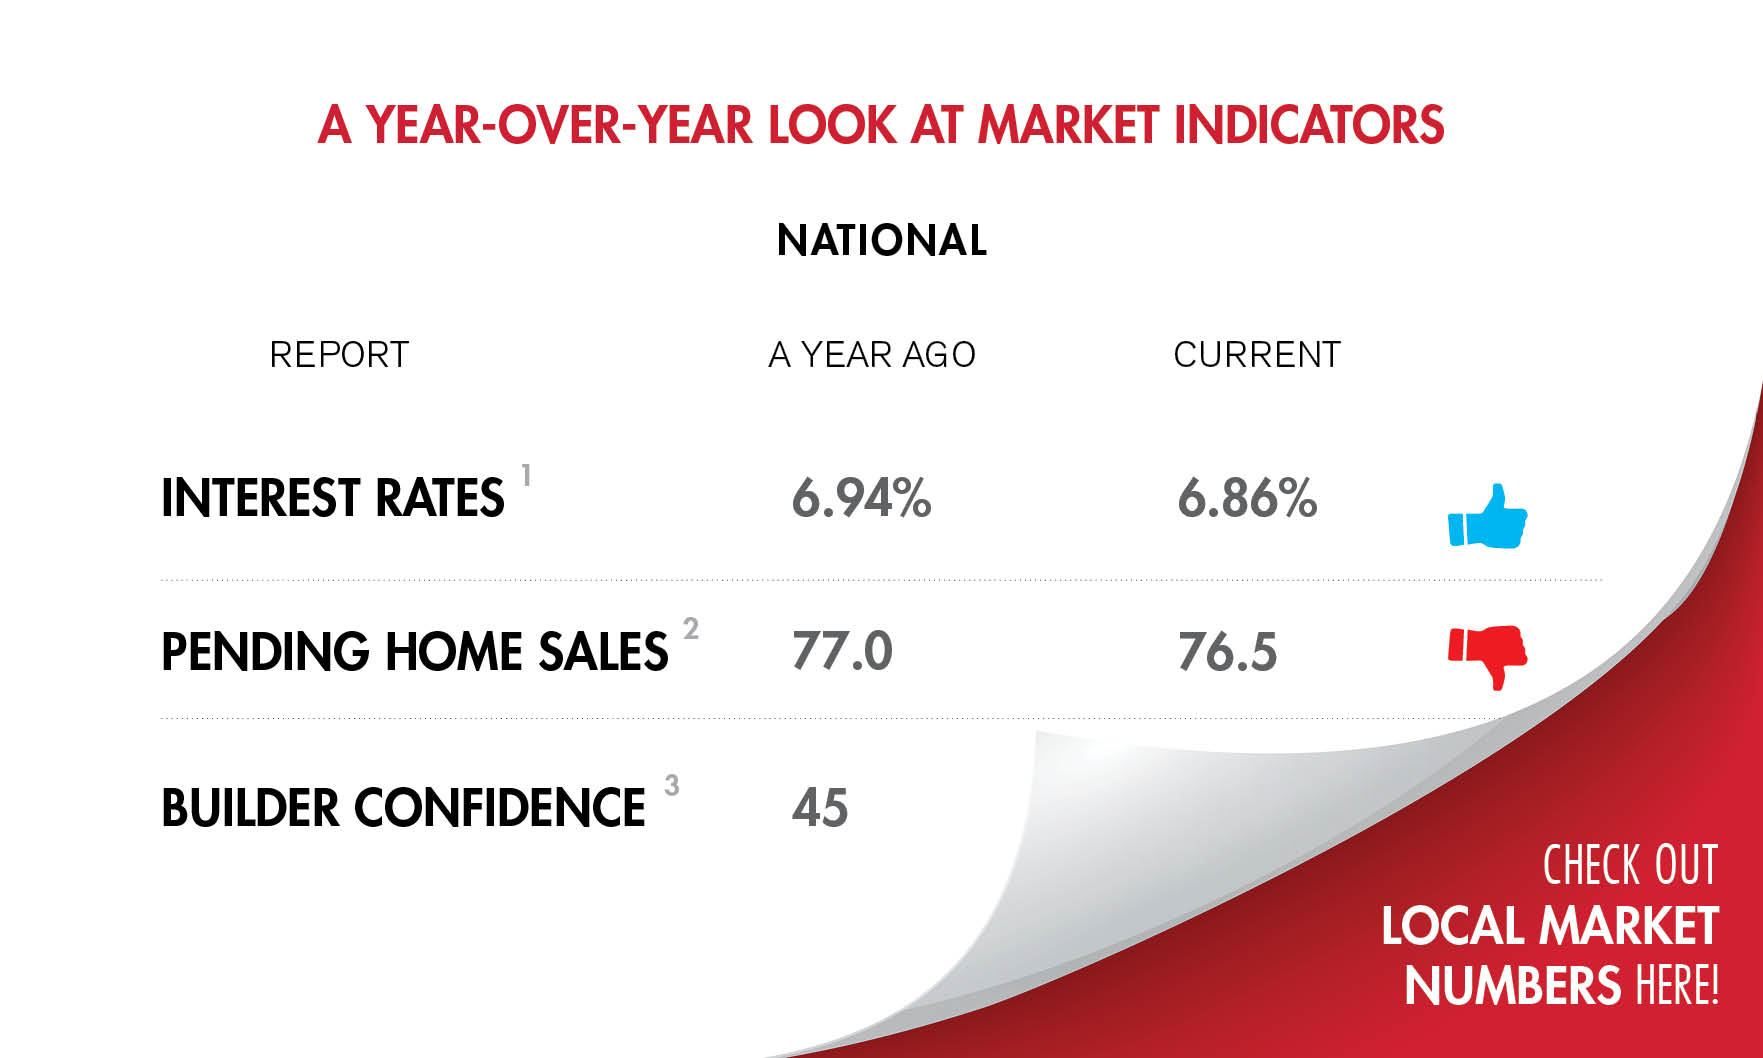
Existing-home sales and housing starts both declined, according to this month’s Housing Scorecard.
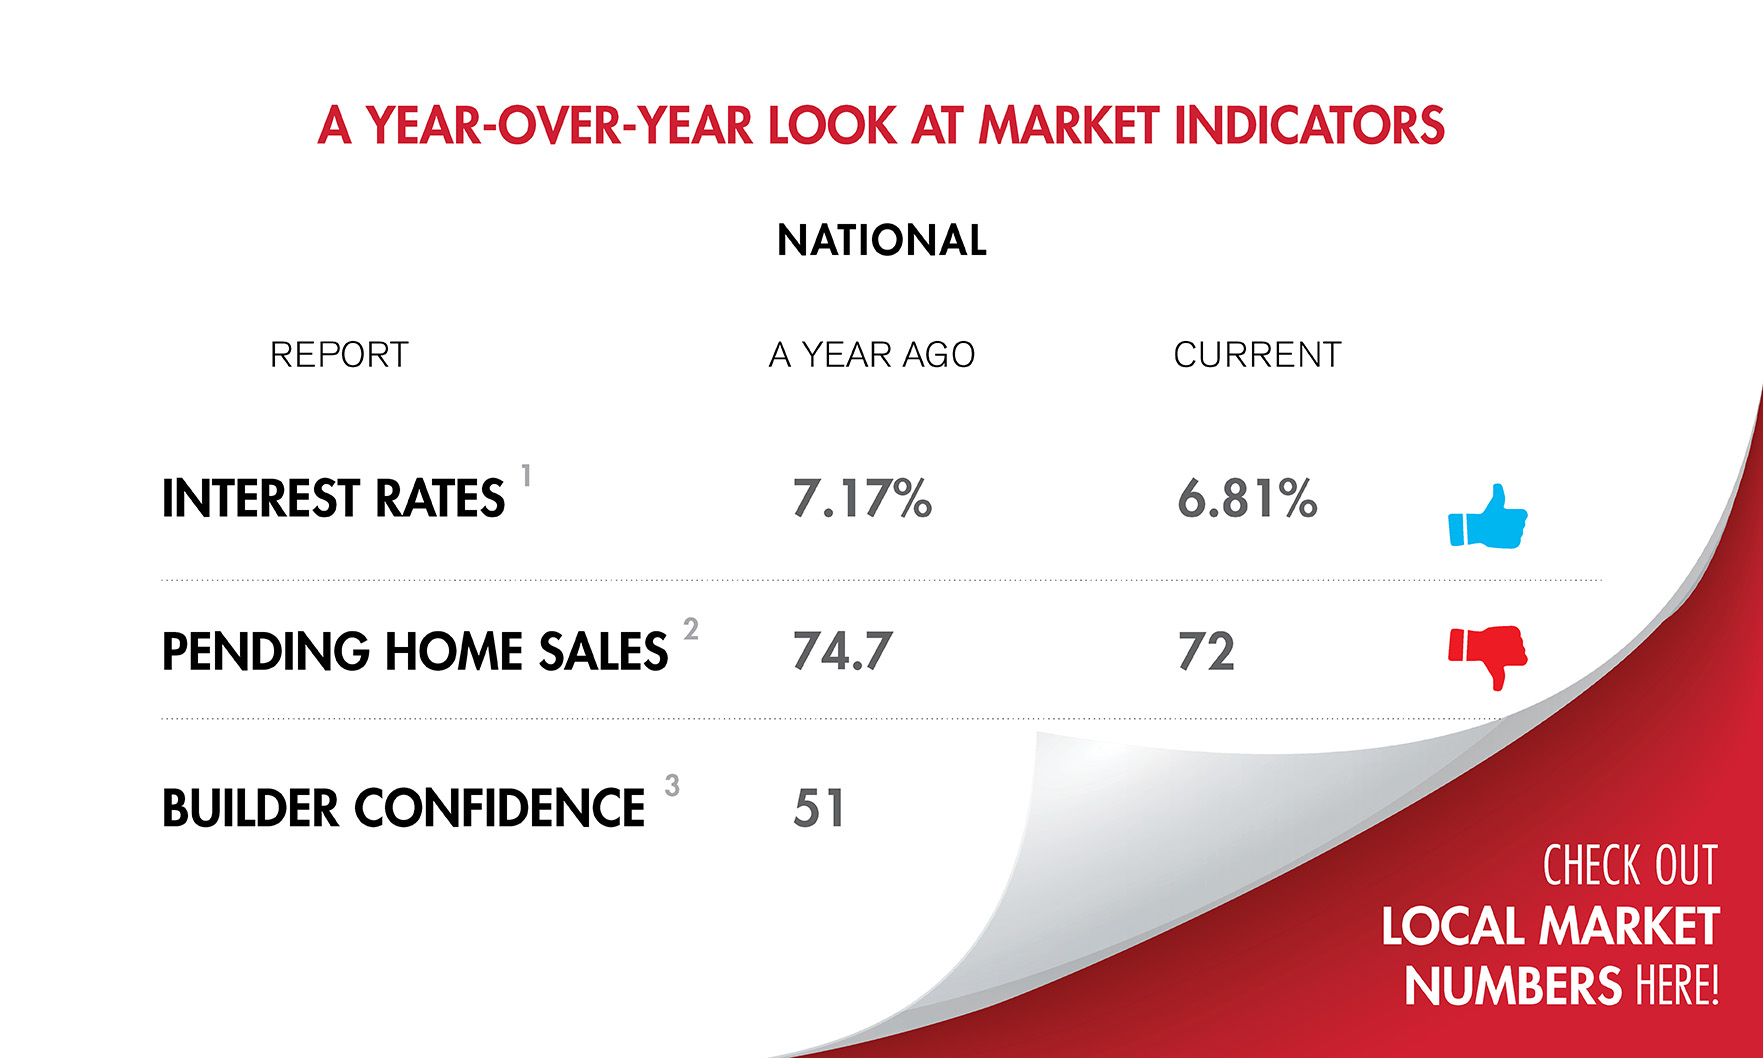
Existing-home sales declined, while housing inventory and days on market rose across Naple and Miami-Dade, Broward and Palm Beach counties.

South Florida housing inventory was up across the board last month while existing-home sales were mixed.
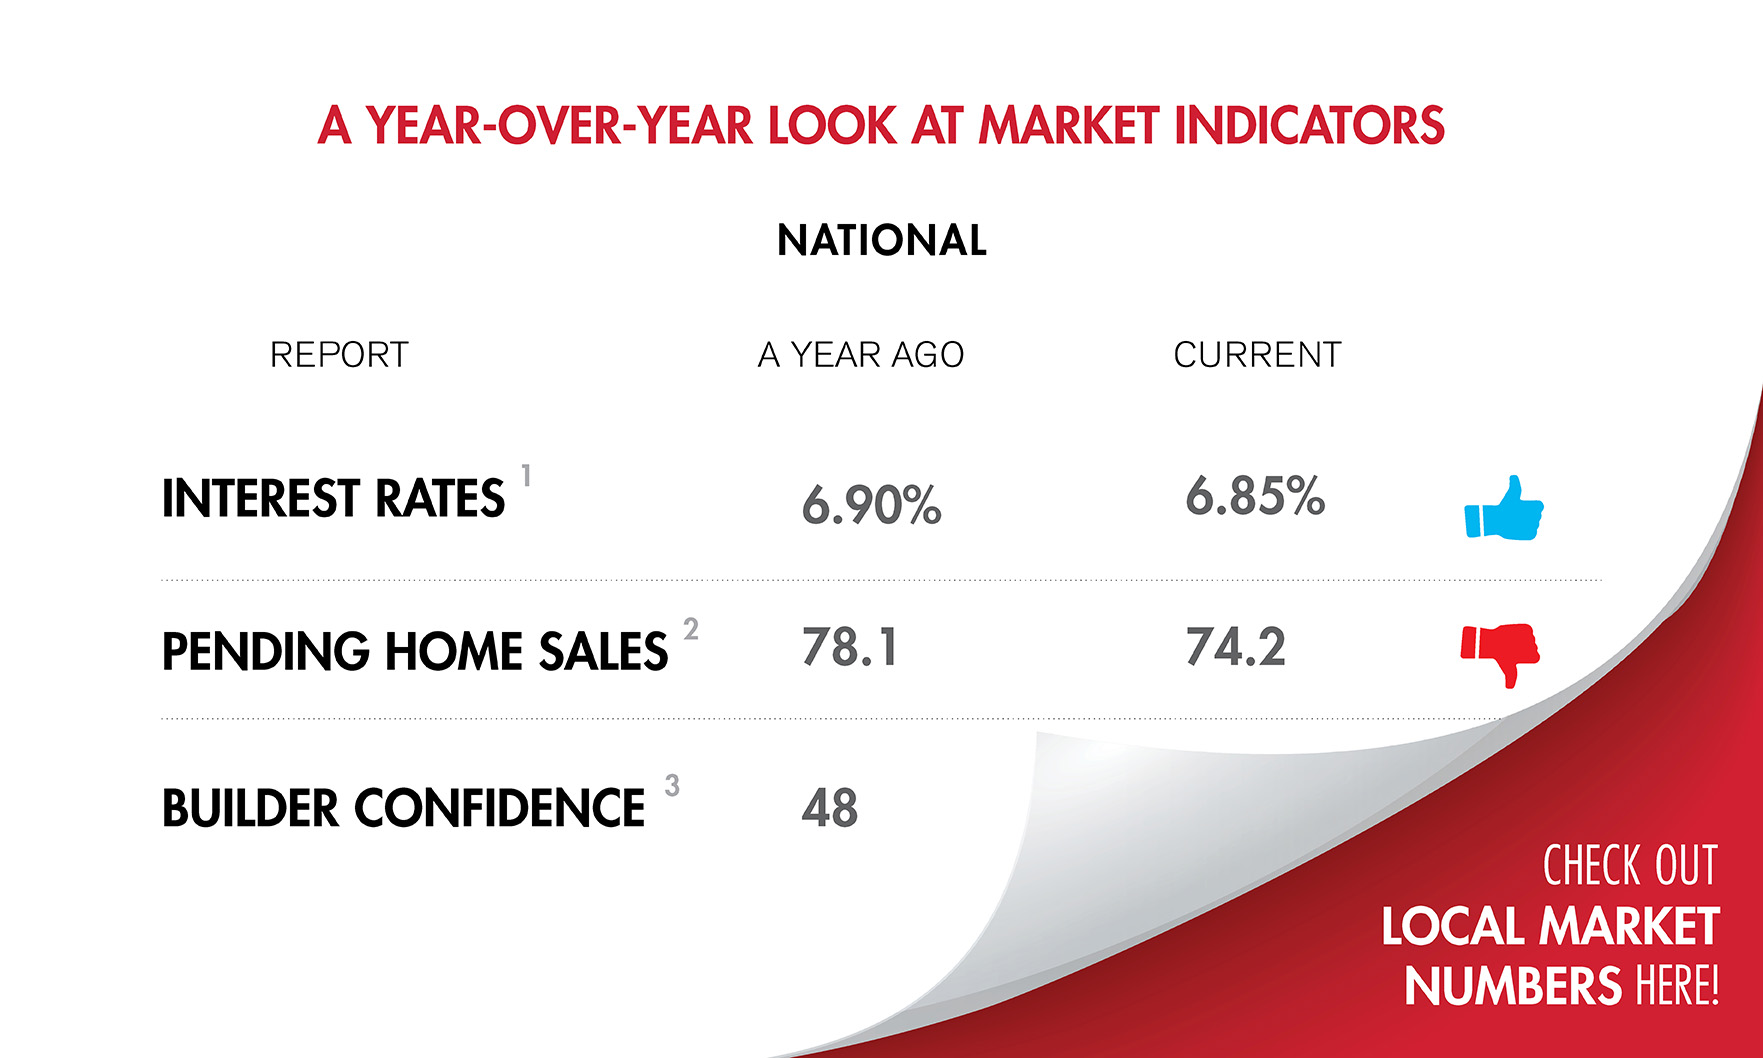
Taking a closer look at key metrics in the South Florida residential real estate market, including housing starts, sales and more.
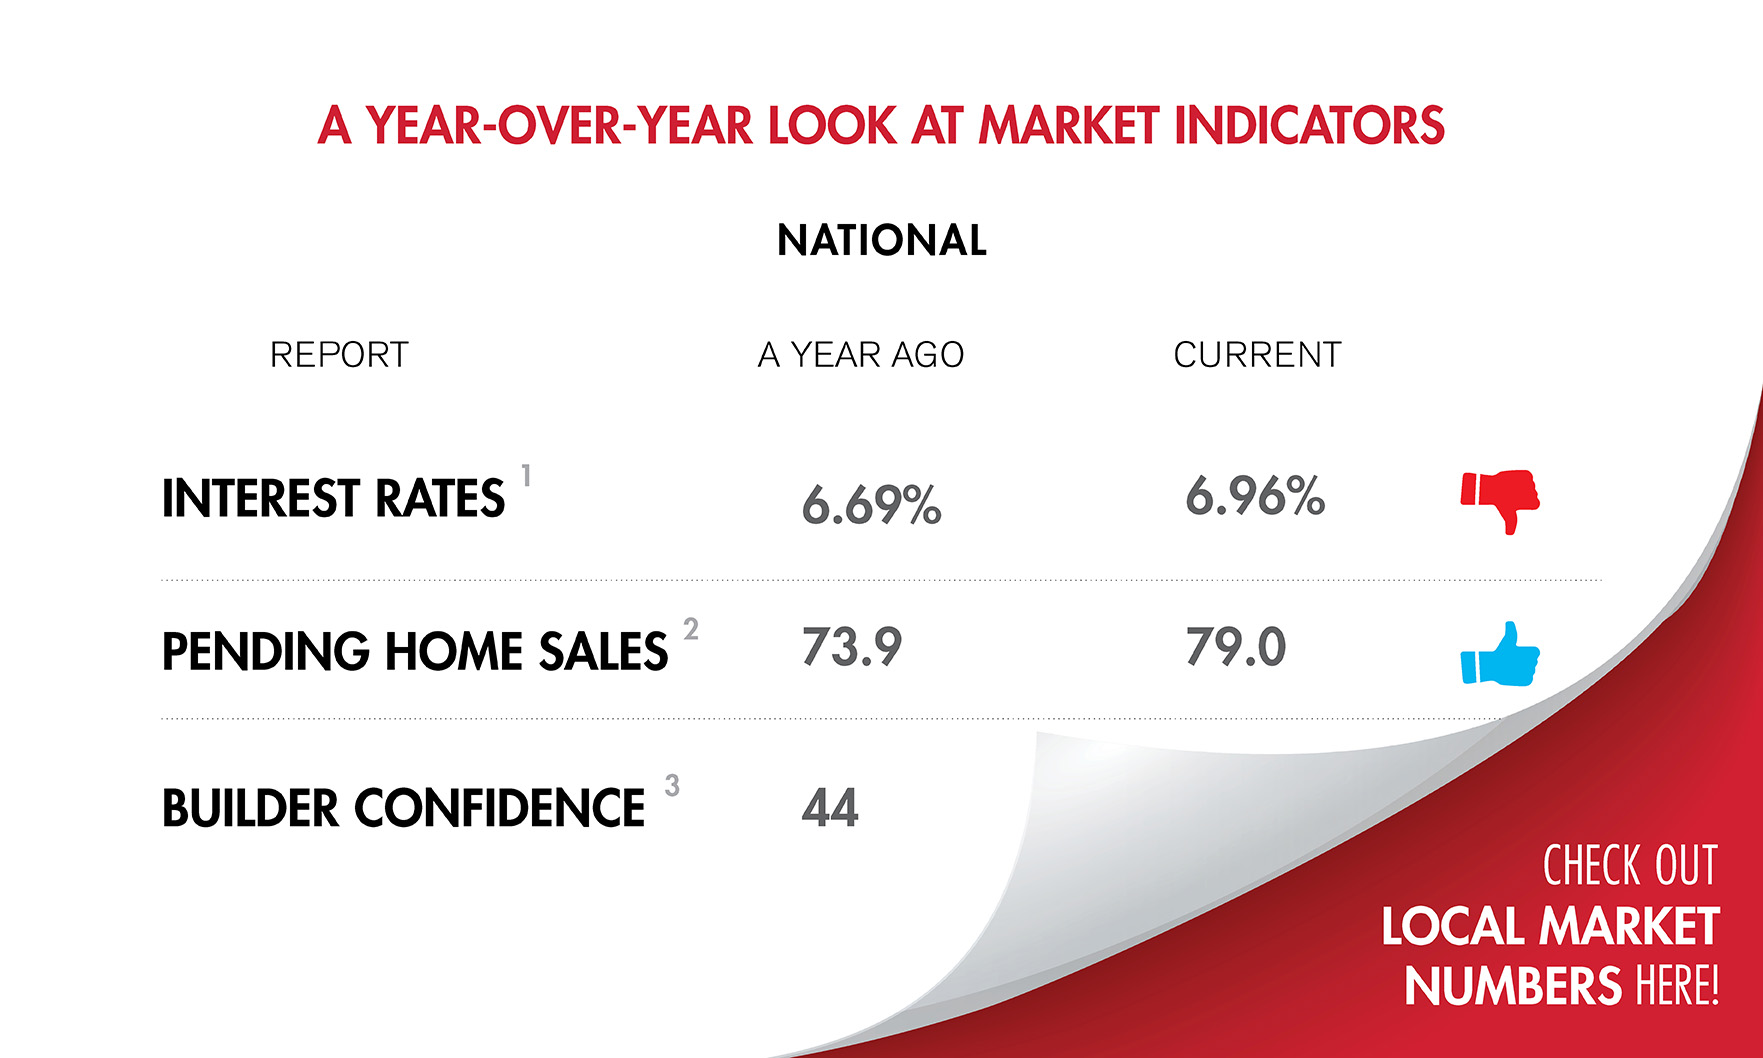
Days on market and housing inventory both increased across South Florida.

At the same time, housing starts and housing inventory posted healthy gains.
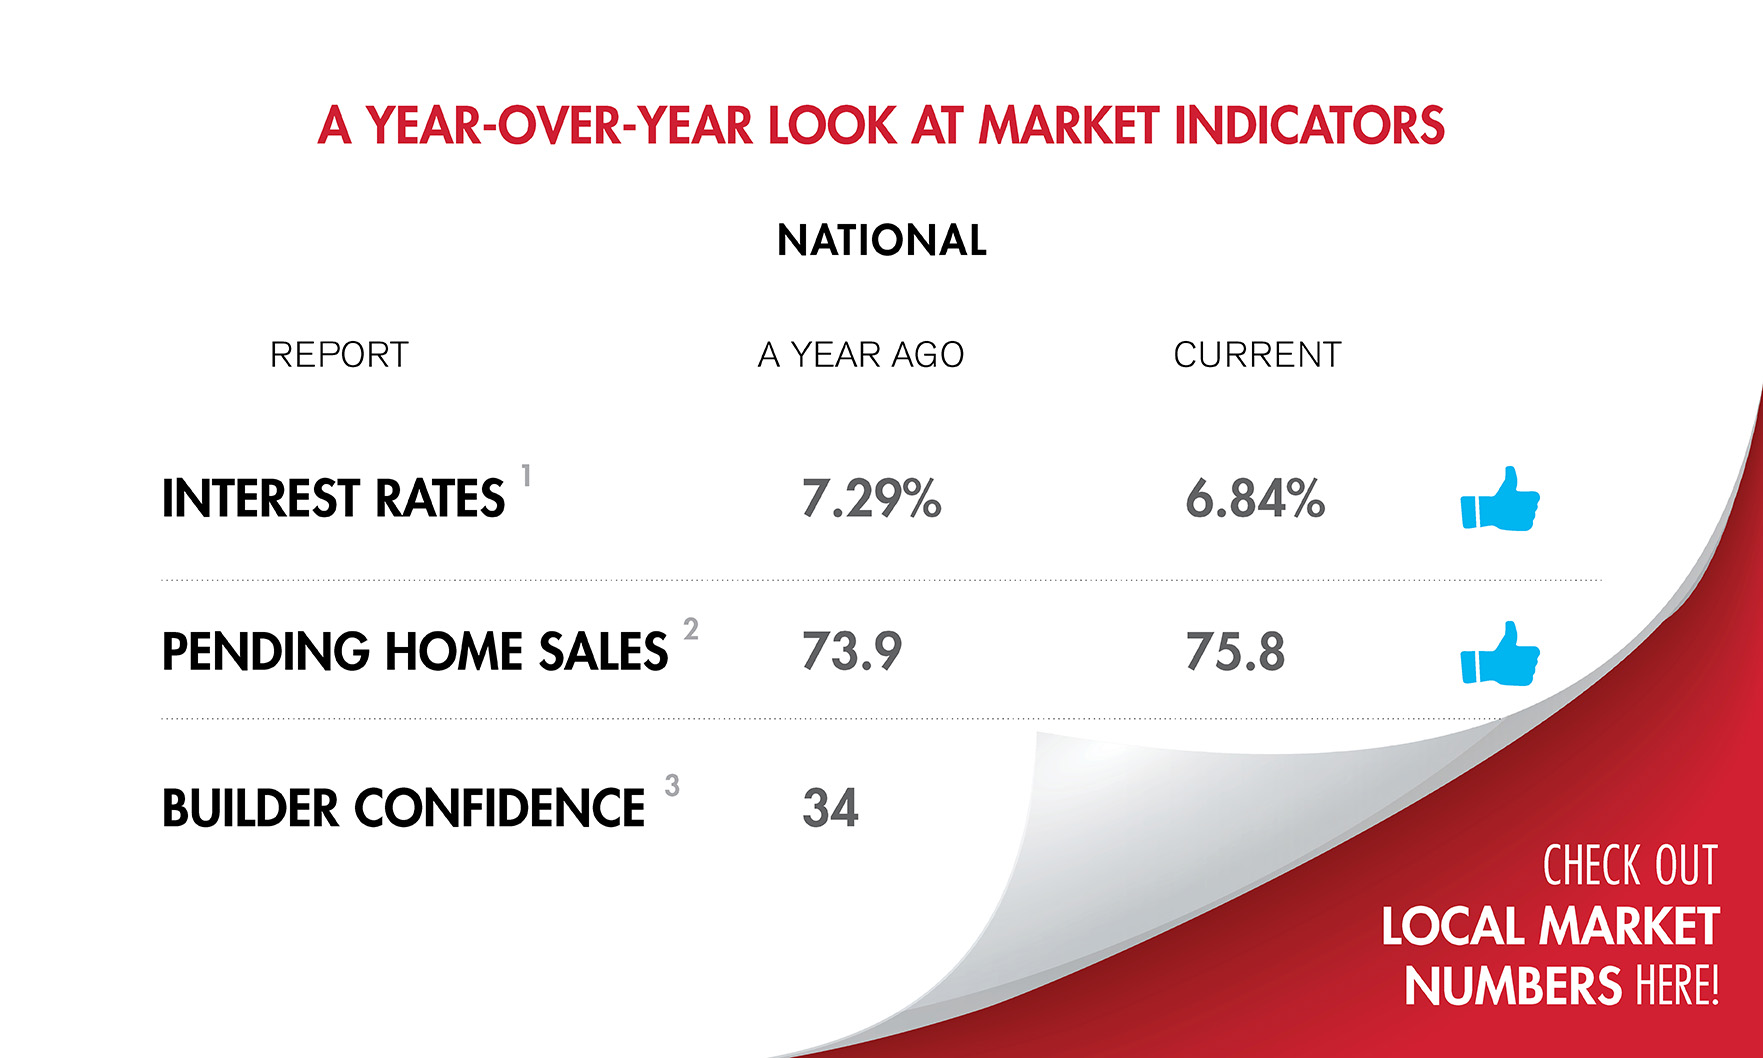
At the same time, housing starts were down, while inventory was up.
At the same time, existing-home sales and housing starts declined.
